7 MIN READ
Economic Considerations for Fertilizer Inputs
October 29, 2025
- Return on investment for crop inputs is being scrutinized now more than ever.
- Land and yield goals vary for each farmer and increasing yields with additional fertilizer does not always increase return on input costs.
- Recent fertilizer outlooks encourage staying at or below the maximum return to nitrogen rate.
Fertilizer Decision Making
Especially when there are supply concerns, inputs are scrutinized, decreased, and even considered optional. Limited fertilizer supply can increase cost and jeopardize profitability. Considering the elimination of nitrogen (N) compromises yield generating cash flow. Growers, therefore, should view fertilizer as a business decision approached by putting money towards inputs giving the best return on investment.
Soil Testing Guidance
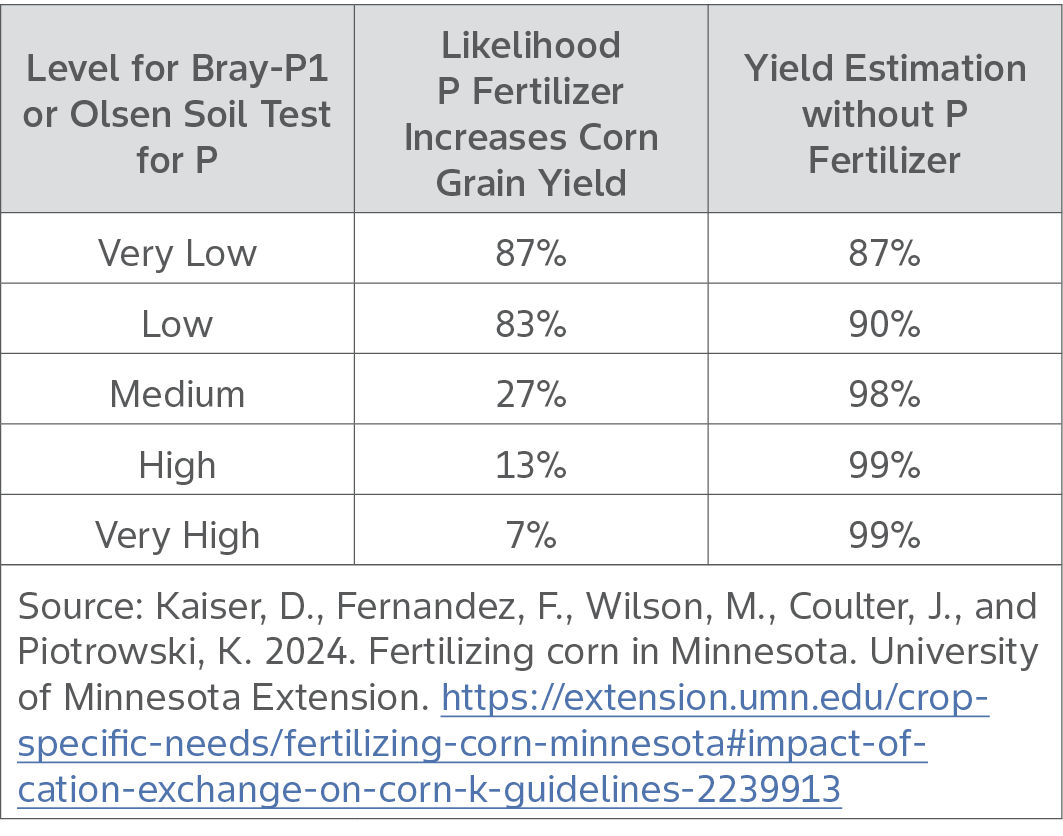
Soil tests determine whether soil is likely to supply each of the nutrients tested. In other words, where soil tests read ‘low’ or ‘very low’ there is a low chance of the soil providing enough nutrients for the next crop, and fertilizer would likely increase yield.1 Crops may not have a yield response to fertilizer due to root exudates, soil pH, and microbial relationships working in a complex way to call for and diffuse nutrients to roots. Alternately, soil nutrients can be replenished based on crop removal amounts. However, crop removal amounts may not be as economical compared to soil testing and prescribing nutrients to fields reported in the very low and low ranges (Table 1).
Table 1. Expected yield response of corn when phosphorus fertilizer is applied based on soil test level.
Maximum Return to Nitrogen Rate (MRTN)
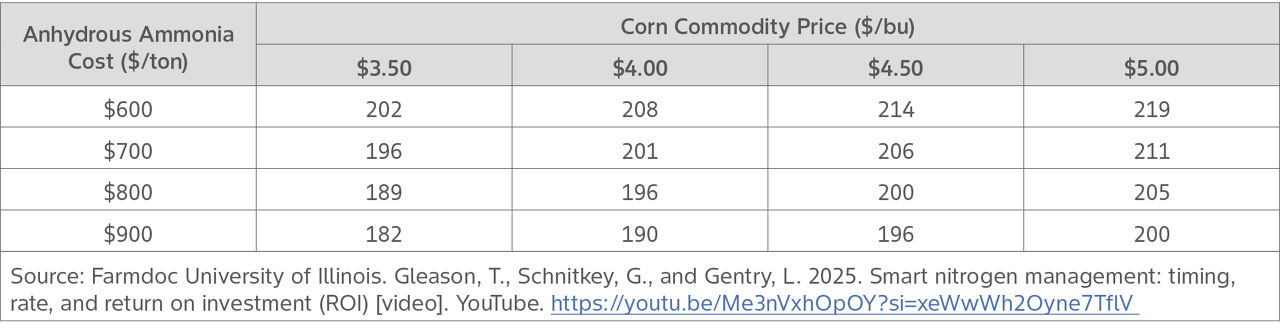
More growers in Illinois have reported they plan to adopt the MRTN approach to N management in 2026.2 Corn Belt states Minnesota, Wisconsin, Iowa, Illinois, Indiana, Ohio, and Michigan are using the MRTN approach to guide corn N recommendation with 1) soil productivity level, 2) price/value ratio, and 3) previous crop. This approach was developed to offer the most profitable N fertilizer application rates, not necessarily the highest yields. Table 2 is an example of how MRTN is viewed for different corn commodity prices compared with cost of anhydrous ammonia (AA). The calculators available at www.cornnratecalc.org can be used to find Maximum Return to N and Most Profitable N Rate in the Corn Belt.
Table 2. Maximum return to anhydrous ammonia nitrogen (lb N/acre) in a corn following corn rotation for the region of Central Illinois.
Fertilizer Application Timing and Preservation
Split-applications of fertilizer are recommended for sandy soils, strip-till programs, and fields with increased risk for N loss.3 The cost of a second application should be considered with fertilizer inputs. Recently, the most profitable N was reported to come from a single-application either in the fall or spring.2 These profitable one-pass programs typically used a greater amount of anhydrous ammonia. Anhydrous ammonia has the greatest concentration of N per ton (82 percent) compared to other fertilizer products, and is an economical choice where offered by retailers. Cool soils and adequate moisture are needed to cooperate with farmers applying AA.
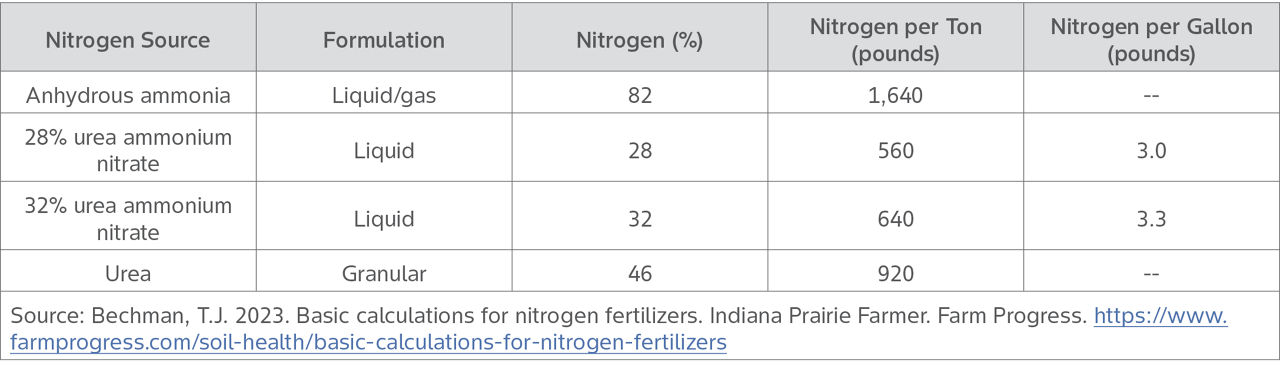
Alternative fertilizer products, while they may be greater in cost, can be the better option when AA is not available or conditions are not favorable for AA application. Including a nitrification inhibitor with fall N fertilizers makes economic and agronomic sense although it can add $0.08 to each pound of N being applied.4 This upcharge to conserve N over winter makes sense as the N investment should not be lost before the nutrient can be used by plants. Nitrogen amount per unit of fertilizer product is critical to meet the nutrient need without wasting investment (Table 3).
Table 3. Common fertilizer products and the amount of nitrogen.
Phosphorus and Potassium Nutrients
In a fertilizer year with phosphorus (P) supply issues, building up P soil levels is not likely to result in a return on investment. Evaluate P needs based on soil test results. Soils reporting high P levels (50 ppm Bray-P1 test) or greater could have adequate P for 15 to 20 years without replenishing.5 Research has estimated high testing P soils (25 to 50 ppm) would lose just 2 ppm each year without P applications. Consider soil levels greater than 20 ppm (Olsen) and 25 ppm (Bray-P1) being high enough to not need P fertilizer applications this year.6
Potassium (K) guidelines are a little more difficult as this nutrient is held onto soil cation exchange sites of clays. Sandy and loamy sands have little clay and low cation exchange capacity and K can leach from these soils. Soil tests with a very low or low report may need 6 to 20 lbs K2O/acre to raise ammonium acetate K tests by 1ppm.7 Continue testing low K soils as seasonal variability has been demonstrated in K soil test research.
Banded Fertilizer Applications
To further reduce amounts purchased and environmental loss, consider banded applications to supply crops with necessary nutrients where they can be reached by root growth. Salt index of each fertilizer product should be assessed and band placement a safe distance from seeds to avoid seedling injury. See this article on In-Furrow Starter Fertilizer to Corn to learn about fertilizer placement and salt index of fertilizer sources.
Farm Profit Trends
A 2023 study by the Farm Financial Management Database (FINBIN) showed the most profitable farms spent 33 percent less per acre on their fertilizer costs.8 Farms with a maximum yield goal may not always have the maximum return on their fertilizer investment. Reasons a fertilizer cost might not be returned:
- Applying more than needed as insurance against nutrient losses
- Using new products, claiming efficiency, but containing fewer nutrients per unit
- Applying according to crop removal rates, not soil test values
Summary
Lack of nutrients can be yield limiting; however, surplus fertilizer cuts down profitability. Applying more N than corn needs would leave it pound for pound out on the field.7 Soil tests should guide if and how much fertilizer is purchased to supply nutrients to upcoming crop. Although difficult, it is recommended to take the emotion out of fertilizer decisions and look at purchases as a cost to profit.
Sources
1Horneck, D.A, Sullivan, D.M., and Hart, J.M. 2011. Soil test interpretation guide. Oregon State University Extension. EC1478. https://www.canr.msu.edu/foodsystems/uploads/files/soil_test_interpretation.pdf
2Farmdoc University of Illinois. Gleason, T., Schnitkey, G., and Gentry, L. 2025. Smart nitrogen management: timing, rate, and return on investment (ROI) [video]. YouTube. https://youtu.be/Me3nVxhOpOY?si=xeWwWh2Oyne7TflV
3Carlson, B. 2023. Split-applying nitrogen for corn: Three keys for successful sidedress applications. University of Minnesota Extension. https://blog-crop-news.extension.umn.edu/2023/03/split-applying-nitrogen-for-corn-three.html
4Carlson, B. and Fernandez, F. 2021. High nitrogen fertilizer costs. What should corn growers be thinking about? University of Minnesota Extension. https://blog-crop-news.extension.umn.edu/2021/11/high-nitrogen-fertilizer-costs-what.html
5Kaiser, D. 2022. No P, no problem? Skipping phosphorus fertilizer application may make agronomic, economic sense. University of Minnesota Extension. https://blog-crop-news.extension.umn.edu/2022/10/no-p-no-problem-skipping-phosphorus.html
6Kaiser, D., Fernandez, F., Wilson, M., Coulter, J., Piotrowski, K. 2024. Fertilizing corn in Minnesota. University of Minnesota Extension. https://extension.umn.edu/crop-specific-needs/fertilizing-corn-minnesota#special-considerations-2239914
7Mallarino, A.P., Sawer, J.E., Barnhart, S.K., and Licht, M.A. 2023. Iowa State University Extension. PM1688. https://isuaamncus122stg.blob.core.windows.net/shop/PM1688.pdf
8Carlson, B. 2024. Are you overspending on fertilizer? University of Minnesota Extension. https://blog-crop-news.extension.umn.edu/2024/04/are-you-overspending-on-fertilizer.html
1213_660592
Disclaimer
ALWAYS READ AND FOLLOW GRAIN MARKETING AND ALL OTHER STEWARDSHIP PRACTICES AND PESTICIDE LABEL DIRECTIONS.