7 MIN READ
Using Soil Samples to Manage Fertility in Soybean
January 30, 2024
Regardless of the crop, the basis for all fertility programs should be the 4 Rs: The Right nutrient applied in the Right place at the Right rate at the Right time. The collection of soil samples and their analysis provides important information to help achieve these four fundamentals.1
Essential Plant Nutrients
The essential nutrients required for a plant to complete its life cycle are categorized as macro- or micronutrients based on the quantity of each element that the plant needs. Table 1 categorizes the essential elements needed for soybean plant growth and the chemical form in which the nutrient is taken up by the plants.2,3
Table 1. Essential plant nutrients supplied from the soil required for soybean growth and the plant uptake form of the nutrients.
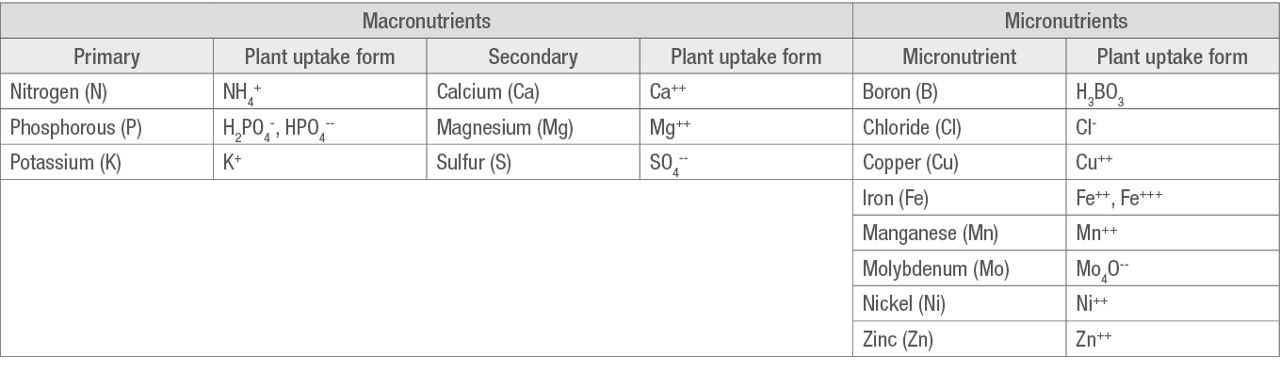
Analyses of other important soil characteristics that are usually available from soil testing laboratories may include organic matter (OM), soil pH, buffer pH, excess lime, soluble salts (salinity), and cation exchange capacity (CEC).
N, P, and K Removal in the Grain of a Soybean Crop
The uptake of different nutrients can vary based on plant growth stages. Research has shown that N, P, Cu, and S have the greatest percentage of total nutrient uptake in the grain during the seed-filling growth stages. Potassium (K) uptake occurs primarily during the late vegetative and early reproductive growth stages.4
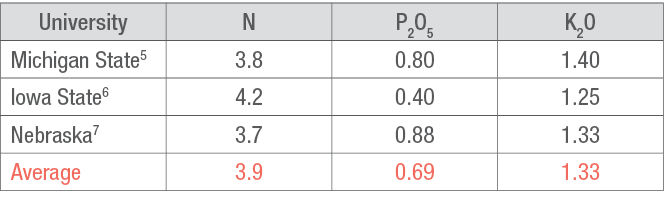
Customarily, additional amounts of P and K are applied prior to planting corn to sustain the following year’s soybean crop. The amounts for this application should be based on soil tests, crop removal rates (Table 2), and realistic yield goals for corn and soybean crops. Healthy soybean plants can produce or fix N from the air into readily available ammonia in their root nodules because of the bacterium Bradyrhizobium japonicum that lives in and around the nodules.
Table 2. Estimates by three universities of pounds per bushel (lb/bu) of nutrient removal in the grain from a soybean crop.
Soil Sampling Methods
The best method for determining current plant-available soil nutrients is to analyze properly collected soil samples. The practical time to collect soil samples is after harvest but prior to the onset of winter-time cold temperatures that can change soil properties physically and chemically. At a minimum, soil samples should be collected every three to four years; annual soil testing provides the best measurement of available nutrients but may not be economical for many operations. Sampling should occur during the same time frame each year.
The number of samples collected should be sufficient to capture variability within each field and balance between sampling cost and desired precision. Samples should be taken from the surface to tillage depth (about 6 to 8 inches). In long-term reduced tillage systems (especially no-till systems), a shallow-surface to 1-inch-deep sample should be collected along with a surface to 6-inch-deep sample because fertility stratifications can occur. The samples should be stored and analyzed separately.
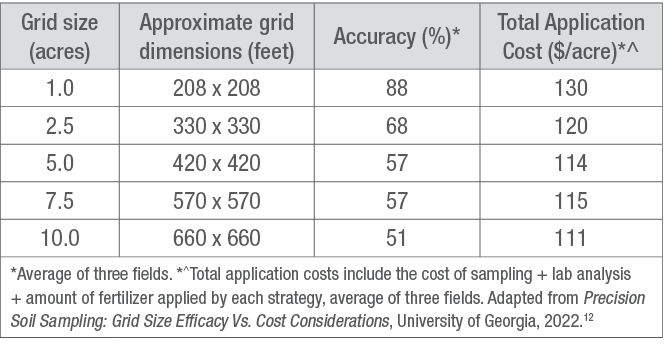
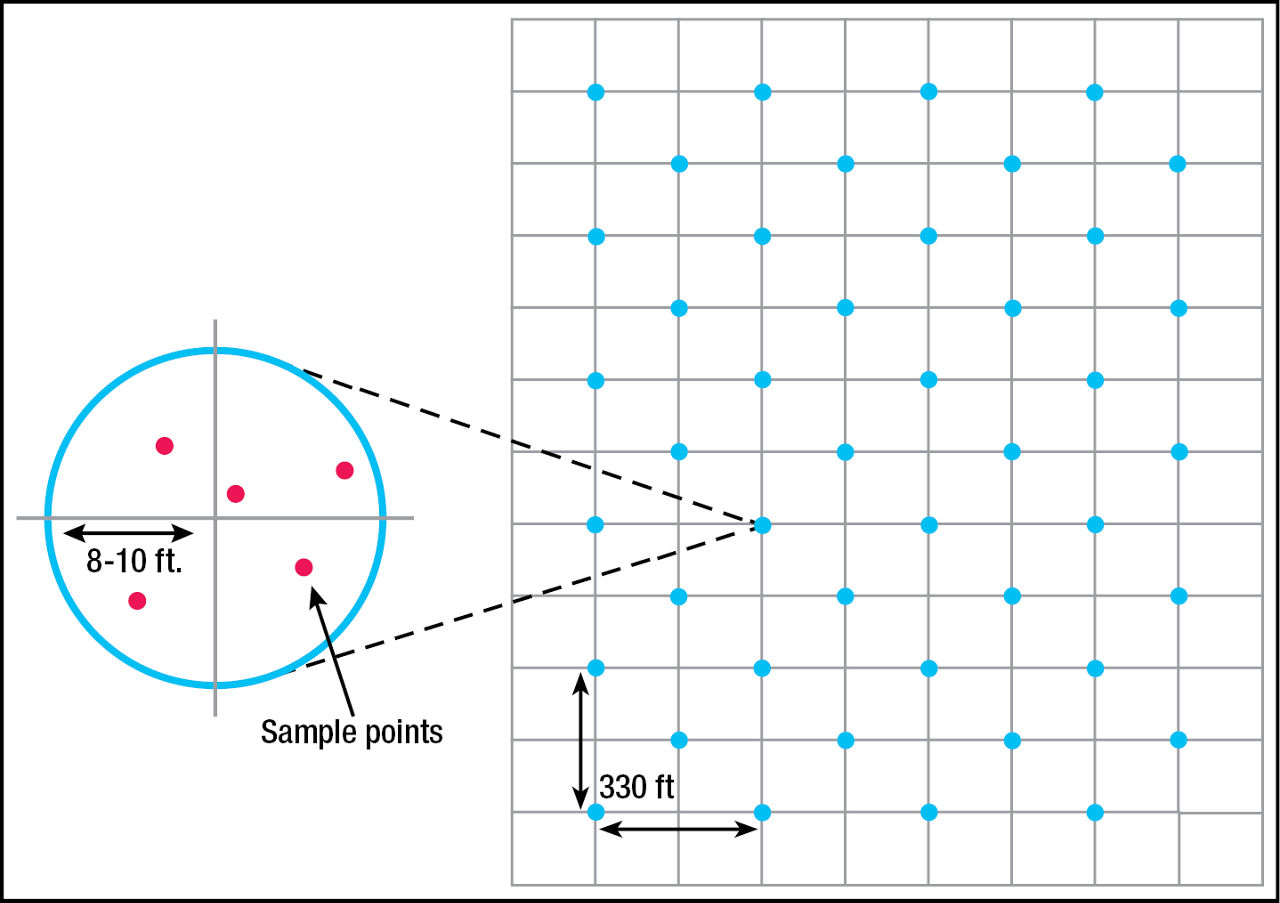
GRID SAMPLING: The recommended grid size is 2.5 acres or less if the goal is to develop a resource of nutrient maps that can be used with confidence over several years.11 Larger grid sizes have been used and may be acceptable if a field is known to have little variation within it. The smaller the cell, the greater the precision. Global positioning system (GPS) technology is used to identify each grid. Table 3 compares the accuracy and total application costs of five grid sampling strategies developed by the University of Georgia. Within each grid, 5 to 7 cores should be collected, composited, and analyzed separately from the other grids (Figure 1). Based on the results, application rates can be prescribed for each grid and applied with a variable rate applicator.
Table 3. Approximate grid dimensions, accuracy, and total application cost of various grid sampling strategies.
Zone (or Direct) Sampling: If grid sampling is not practical or economical, 10 to 15 core samples should be collected by using a “Z” or “W” pattern across a defined area (zone) as delineated by soil series or topography maps, composited, and analyzed separate from other sampling areas. If a field has a number of soil types, it is recommended to collect samples based on soil type zones, rather than mixing soil types.
Composite Sampling: The least representative sampling technique is to composite one sample from an entire field from cores drawn across the field. A composite sample should represent an area no larger than 40 acres.9
To help avoid skewing results for the latter two sampling techniques, samples should not be the from fertilizer bands, headlands, dead furrows, dusting areas from limestone roads, and areas where stockpiles of P, K, lime, manure, or other elements or composts existed.
Regardless of the collection pattern used, samples should be collected in clean plastic containers as metal containers can contaminate the samples. Probes or augers should be stainless steel and should not be coated with Zn, Cu, or other potential contaminants. Properly labeled composited samples should be placed into containers designed for soil samples and sent immediately to a soil lab or allowed to dry in a dust-free environment for later submission. Soil information sheets should be thoroughly completed with accurate information such as cropping history, crop to be planted, tillage methods, soil region, and realistic yield goals base on the past 3 to 5 years. The analysis requested should include macro- and micronutrient levels, soil pH, organic matter (OM), soluble salts (salinity), and cation exchange capacity (CEC).
Understanding the Laboratory Results
Laboratory results may be reported in parts per million (ppm) or pounds per acre (lb/acre).
To convert ppm to lb/acre, multiply ppm by 2 (lb/acre = ppm x 2).
To convert lb/acre to ppm, divide lb/acre by 2 (ppm = lb/acre ÷ 2).
Nitrogen (N): Generally, results on N availability are unimportant for soybean production because of the plants’ ability to produce N. Soil available nitrate (NO3-) or ammonium (NH4+) is initially needed for soybean seedling establishment until the nodules begin producing N. If a soybean crop has not been produced for several years, the seed should be inoculated with Bradyrhizobium japonicum bacterium to facilitate nodule growth.
Phosphorus (P): Plant-available P in the soil solution is related to pH; therefore, labs may use different P extraction methods depending on the soil pH. The Bray P1 (weak Bray) for acidic soils with pH less than 7.0 is used to measure readily available P. The Bray2 (strong Bray) for highly acidic soils measures readily available P plus a part of the active reserve soil P (useful where rock phosphate has been applied). Mehlich-3 P for acidic soils is used for P, K, Ca, Mg, Na and micronutrient testing. The Olsen P test is used for neutral- to high-alkaline soils (pH of 7.3 or greater) where Ca can tie up P and make it less available for plant growth. Monitoring P levels, applying only what is needed, and using appropriate application methods are all important because of the potential loss of P by erosion and/or runoff, which can be problematic for water quality.
Potassium (K): Three forms of K are in equilibrium in the soil: unavailable, slowly available, and readily available. About 90% to 98% of total soil K contained in feldspars and micas is unavailable. Slowly available K is “fixed” between soil clay layers and may be released when soil becomes wet; however, soil tests do not provide a value for fixed K. Readily available K is measured by soil tests because of its solubility in water. Submitting air dried soil samples may result in underestimating the amount of available K because the dried soil “fixes” K. The underestimation can result in a soil report indicating a need for additional K to be applied even when no application is necessary. For soybean production, broadcasting and incorporating fertilizer sources prior to planting have proven to be the most effective for deficient soils. Banding can be used in reduced tillage systems.10 Michigan State recommends maintaining soil K levels between 0 and 30 ppm above critical K levels to help maximize soybean yields. The critical level is calculated by multiplying the CEC by 2.5 and adding 75.8
Micronutrients: Most soils have adequate amounts of the micronutrients required for soybean production. However, obtaining soil test values for these nutrients is important so they can be addressed if needed. Deficiencies may be observed more often in coarse-textured, muck, and peat soils. Of the micronutrients, iron (Fe) is likely the most important in high-pH areas in the Dakotas, Minnesota, Nebraska, and Iowa because iron deficiency chlorosis (IDC) can occur. Soil testing for Fe itself is not generally needed but a determination of soil pH is required to help ascertain if IDC could be problematic. For more information on IDC, see Iron Deficiency Chlorosis.
Sulfur (S) applications may be needed in coarse-textured soils that are low in OM. If S is deficient, it should be applied prior to planting because it is needed early in the growth of soybean.
Manganese (Mn) soil deficiencies may be observed in muck, dark-colored sandy soils with pH values above 5.8, or lakebed soils with pH values above 6.5. Broadcasting or banding is not recommended because of high soil fixation and the economics of banding applications. The most economical and effective method to address a soil Mn deficiency is a foliar application of 1 to 2 lb/acre of actual Mn.8
Boron (B) is most likely to be deficient in coarse-textured soils, high OM soils, and lakebed soils with high pH values. Broadcasting 1 lb/acre (2 lb/acre maximum) of actual B blended with K fertilizer two weeks prior to planting can address a soil deficiency. A foliar application of 0.25 lb/acre (0.5 b/acre maximum) during early bloom is another method. Exceeding the maximum recommended levels can potentially cause crop injury through B toxicity.8
Organic Matter (OM): Soil OM affects many biological, chemical, and physical properties of soil that can influence nutrient availability.
Soil pH: As defined earlier, the optimal pH range for soybean growth is between 6.3 and 6.5. Soil pH is measured on a logarithmic scale of 0 (acid) to 14 (alkaline). A soil pH of 6 is 10 times more acidic than a soil with a pH of 7, and a pH of 5 is 100 times more acidic than a pH of 7. The availability of different nutrients is greatly dependent on pH levels. Most nutrients are available for plant uptake in a pH range of about 5.5 to 7.0.
Over time, crop production without lime applications can result in a decrease in soil pH (becoming more acidic) which decreases the availability of crucial nutrients. Soil testing laboratories use a buffer pH test to determine the amount of lime required to bring the soil back within an acceptable pH range. A large change in buffer pH indicates that soil pH can be changed easily with a low rate of lime, whereas a small change indicates that a higher lime rate is needed. The quickness with which pH can be changed is dependent on the coarseness and geographical source of the lime.
Cation Exchange Capacity (CEC): This value is a measure of the soil’s capacity to hold positively charged particles such as K+, NH4+, Cu2+, Fe2+, and Mn2+. The capacity to hold these elements is due to the negative charge possessed by clay particles within the soil and the OM. A CEC above 10 milliequivalents per 100 grams (10 meq/100 g) is considered adequate.8 Higher CEC values are an indication that the soil contains more clay and/or OM. Higher CEC soils typically have greater water holding capacities, are able to hold K and Mg more readily, can maintain soil pH longer and, if necessary, require more lime to increase soil pH.8 Building the soil’s OM can help increase soil CEC.
Salinity: High soluble-salt content (salinity) can cause water stress, nutrient imbalances in plants, and may affect nutrient uptake. Seedlings are sensitive to higher-than-normal soluble salts. Leaching can cause soil salinity levels to change rapidly; therefore, salinity sampling should occur periodically during the growing season.
Sources:
1 Rogers, E. 2019. The 4R’s of nutrient management. MSU Extension Field Crops. Michigan State University. https://www.canr.msu.edu/news/the-4r-s-of-nutrient-management
2 Timmerman, A. et al. Soil and nutrients 1: Nutrients required for optimal soybean production. CropWatch. University of Nebraska-Lincoln. https://cropwatch.unl.edu/soybean-management/soil-and-nutrients
3Bagale, S. 2021. Nutrient Management for soybean crops. International Journal of Agronomy, 2021: 3304634. https://doi.org/10.1155/2021/3304634
4 Bender, R.R., Haegele, J.W., and Below, F.E. 2015. Nutrient uptake and partitioning highlights from soybean uptake studies. https://cropphysiology.cropsci.illinois.edu/nutrient-uptake-and-partitioning-2/
5 Silva, G. 2017. Nutrient removal rates by grain crops. Michigan State University Extension. https://www.canr.msu.edu/news/nutrient_removal_rates_by_grain_crops
6 Nutrient requirements – soybean. Iowa State University Extension and Outreach. https://crops.extension.iastate.edu/encyclopedia/nutrient-requirements-soybean
7 Ferguson, R.B., Shapiro, C. A., Dobermann, A.R., and Wortmann, C.S. Revised 2006. Fertilizer recommendations for soybean. NebGuide. G859. Nebraska Extension. University of Nebraska. https://extension.unl.edu/statewide/nerec/Fert%20for%20Soybean%20g859%202006.pdf
8 Staton, M. 2013. Nutrient management recommendations for high-yield soybean production. Soybean Management and Research Technology (SMART). MSU Extension. Michigan State University. https://www.canr.msu.edu/news/nutrient_management_recommendations_for_high_yield_soybean_production
9 Ward Laboratories, Kearney, NE. Soil & soil health analysis traditional sampling procedure. WardGuide. https://www.wardlab.com/submit-a-sample/soil-health-analysis/traditional-sampling-procedure/
10 Kaiser, D.E. and Rosen, C.J. 2018. Potassium for crop production. University of Minnesota Extension. University of Minnesota. https://extension.umn.edu/phosphorus-and-potassium/potassium-crop-production
11 Ferguson, R. B. and Hergert, G. W. Soil sampling for precision agriculture. University of Nebraska Cooperative Extension. EC 00-154. https://cropwatch.unl.edu/documents/Soil%20Sampling%20for%20Precision%20Agriculture%2C%20EC154.pdf
12 Virk, S. 2022. Precision soil sampling: Grid size efficacy vs. cost considerations. University of Georgia Precision Ag Extension. https://site.extension.uga.edu/precisionag/2022/11/precision-soil-sampling-grid-size-efficacy-vs-cost-considerations/
Web sources verified December 8, 2023 1313_65761
Figure 1. Nutrient availability based on soil pH. Illinois Agronomy Handbook. Permission granted for use by Dr. Emerson Nafziger, University of Illinois.
Disclaimer
ALWAYS READ AND FOLLOW GRAIN MARKETING AND ALL OTHER STEWARDSHIP PRACTICES AND PESTICIDE LABEL DIRECTIONS.