5 MIN READ
Corn Maturity, Drydown Rates, and Test Weight
August 4, 2020
Corn Maturity is Relative
The maturity rating for a corn product can be confusing. There are two common interpretations for corn product maturity: physiological maturity, which occurs at black layer, and harvest maturity, which occurs when the product can be harvested for grain. Grain moisture content at black layer typically ranges from 25 to 35%, and moisture at harvest maturity is usually below 25%. Corn maturity rating is also thought to be based on the number of days to either physiological or harvest maturity. However, the maturity rating for corn is a relative measurement that compares a product to a set of established products with a known harvest maturity rating. If the new product has a higher or lower moisture content at harvest maturity than the standards, it is assigned a higher or lower maturity rating.
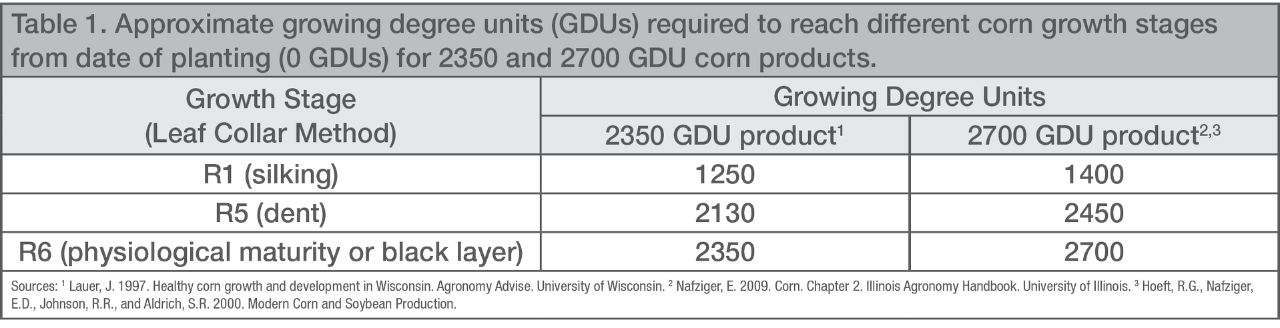
How can the date of physiological maturity be estimated?
All Bayer® corn products have an assigned relative physiological maturity rating and a growing degree unit (GDU) accumulation associated with that rating (Table 1). GDUs are calculated by using the mean daily temperature and subtracting that from the base temperature for corn growth, which is 50°F. Corn development is restricted if the temperature is above 86°F, so it is used as the upper limit when temperatures exceed that level. Seasonal GDUs are determined by summing the daily GDU together, beginning on the date of planting.
What factors influence physiological maturity?
Under normal conditions, the physiological maturity of a corn product is controlled by the genetics of the product. However, physiological maturity can be modified by environment, pests, pathogens, nutrition and management components. Drought and frost can impact and shorten the time required to reach physiological maturity. Injury from stalk and ear feeding insects can shorten physiological maturity. Foliar diseases that reduce the photosynthetic capacity of the plant can result in early plant senescence. Nutrient deficiencies can result in early plant maturity, particularly nitrogen. Management tactics that prolong health, like fungicide application, may delay physiological maturity.4
Grain Drydown Rate
The rate at which corn kernels lose moisture after physiological maturity or black layer is called drydown, which is dependent on husk and kernel characteristics as well as environmental conditions. Moisture loss from the kernels occurs in two distinct ways: first, moisture is lost from the kernel as it accumulates dry matter prior to black layer, followed by evaporation of moisture from the kernel.5
What factors influence grain moisture content at harvest?
The environment can impact the level of kernel moisture at physiological maturity. Plants under stress during grain fill, like extended cloudy conditions, have a lower accumulation of dry matter leading to a higher percentage of moisture in the kernel and vice-versa under ideal conditions.
What is the normal drydown rate for grain corn?
The standard estimate for drydown in the Corn Belt is the loss of 0.5 to 1.0 percentage point daily in September, a 0.25 to 0.5 daily percentage point loss in October, and almost nil in November. The loss rate can be impacted by weather, with warm dry winds increasing the rate and cold and wet conditions lowering the rate. A recently developed tool from Iowa State University, Corn Drydown Calculator, can be used to predict corn grain dry down rates.
Grain Test Weight
Grain test weight is not actually a measure of grain weight, but of grain weight within in a set volume (bushel); therefore, it relates to grain density. The standard test weight for U.S. No. 1 yellow corn is 56 pounds per bushel, while No. 2 corn is 54 pounds per bushel. As an example, if a typical semi-load of 1000 bushels of corn grain has a test weight of 58 pounds per bushel, that would translate to 58,000 pounds or 1035 bushels of No. 1 yellow corn, however, if the grain is only 52 pounds per bushel, it would translate to 52,000 pounds or 928 bushels of No. 1 yellow corn. Test weight can be impacted by grain moisture content, so the moisture content of the grain is “corrected” to the standard moisture level of 15 or 15.5%.
What factors impact corn grain test weight? 6
Many factors can influence the measured test weight of corn. Kernel's physical characteristics, such as size, density, shape, and "slickness" of the outer kernel layer can influence test weight. Stress factors during grain fill that reduce the photosynthetic capacity of the plant, can reduce the starch accumulation in the kernel, resulting in lower test weights. While it is a common perception that yield and test weight are related, the research does not confirm this. It is common for high yield to be associated with low test weight and the converse is also common.7
What is the relationship between grain moisture and test weight?
While many factors influence corn test weight, moisture by far is the most important. In a study at the University of Illinois, five corn products were harvested at 30% grain moisture and allowed to air dry in the laboratory, with moisture content taken every few days. From about 30% down to 27-28% moisture, test weight dropped by up to two pounds across the five corn products. At 25% moisture down to about 15% moisture, test weights rose almost in a straight line. The increase in test weight as moisture dropped from 25 to 15% ranged from 5.3 to 7.7 pounds per bushel and averaged 6.1 pounds per bushel. As moisture dropped below 15%, the rate of increase in test weight slowed but stopped as moisture dropped down to 10 to 11%.8 As the grain dries and moisture decreases, test weight increases. Loss of water from kernel starch usually results in the starch granules packing together more tightly, which increases kernel density and test weight. As the grain dries it shrinks, this allows more grain to pack into the bushel volume. Dry corn is also slicker and can allow more kernels to be packed together as compared to wetter corn.
Sources
1 Lauer, J. 1997. Healthy corn growth and development in Wisconsin. Agronomy Advise. University of Wisconsin.
2 Nafziger, E. 2009. Corn. Chapter 2. Illinois Agronomy Handbook. University of Illinois.
3 Hoeft, R.G., Nafziger, E.D., Johnson, R.R., and Aldrich, S.R. 2000. Modern Corn and Soybean Production.
4 Wise, K. and Mueller, D. 2011. Are fungicides no longer just for fungi? An Analysis of Foliar Fungicide Use in Corn. APSnet Features. https://www.apsnet.org/edcenter/apsnetfeatures/Pages/fungicide.aspx.
5 Licht, M. and Archontoulis, S. 2017. Corn grain dry down in field from maturity to harvest. Iowa State University Extension. https://crops.extension.iastate.edu/cropnews/2017/09/corn-grain-dry-down-field-maturity-harvest.
6 Lindsey, A.J. 2018. Bushels, test weights, and calculations. Ohio State University Extension. https://ohioline.osu.edu/factsheet/agf-503.
7 Nielsen, R. 2018. Corn grain test weight. Purdue University Extension. https://www.agry.purdue.edu/ext/corn/news/timeless/TestWeight.html.
8 Nafziger, E. 2019. Wet grain, test weight, and late corn harvest. University of Illinois Extension. http://bulletin.ipm.illinois.edu/?p=4925.
7005 Q1
Disclaimer
ALWAYS READ AND FOLLOW GRAIN MARKETING AND ALL OTHER STEWARDSHIP PRACTICES AND PESTICIDE LABEL DIRECTIONS.