7 MIN READ
Does Corn Test Weight Affect Grain Yield?
October 7, 2026
Get Year-Round Updates From Our Agronomic Experts
Key Takeaways
- There is little correlation between corn grain test weight and grain yield.
- Corn grain yield is a function of the number of kernels produced per acre and the weight per kernel.
- Kernel size and weight can be influenced by the genetic background of the corn product, growing environment, crop nutrient levels, or insect and disease pressure, and can vary across years even for the same corn product.
- There is an inverse relationship between corn grain moisture content and test weight. The drier the grain, the higher the test weight.
- Although there is no direct relationship between the rate of grain drydown and test weight, there are several hybrid characteristics that can influence how quickly grain might dry down while in the field.
Does the test weight of corn grain impact yield?
Field research has found that grain yield and test weight (TW) do not have a strong or consistent relationship, even though both measurements are important in corn production. In other words, high TW grain does not guarantee higher yield potential or vice versa. While modern corn products vary in their TW, high TW hybrids are not necessarily high-yielding as well. Corn grown in a high yield environment can have low TW (relative to the 56 pound per bushel standard), or corn grown in a stressful environment might have high TW. This was illustrated in a study that compared 22 corn hybrids grown in Ohio during 2012, a drought year, to the same hybrids grown in 2013, with improved growing conditions, which found no consistent relationship between grain yield and TW.1,2
What are the components of corn grain yield?
Corn grain yield is the result of accumulated dry matter (weight) in the kernel and the number of kernels produced per acre. Both of these factors are influenced by the growing environment and the genetics of the corn hybrid. The number of kernels per acre can be broken down into the following three components that can be easily measured in the field and which are independent of kernel weight:
- Average number of harvestable ears per acre. Note that this is not necessarily plant population, as some corn products may have the genetic potential to produce more than one ear depending on plant density.
- Average number of kernel rows per ear.
- Average number of kernels per row.
The final yield component, kernel weight, cannot be measured until the grain moisture content is 15.5%, which is the standard grain moisture content for a 56-lb bushel in the marketplace. Kernel weight can be highly variable year over year, even for the same corn product, and largely dependent on growing conditions and product genetics. Recent research trials from Purdue University found that the number of kernels per bushel ranged from 67,000 to 94,000 with an average of 76,000 per 56-lb bushel.4
More information about the yield components of corn and on estimating yield potential can be found at Assessing Corn Yield Potential.
What is test weight and how does it affect the number of bushels growers are paid for at the grain terminal?
Grain test weight is a measure of grain weight within a set volume (bushel), rather than just grain weight alone; therefore, it relates to grain density and grain quality. The volume is based on a “Winchester” bushel, which is a cylinder 18.5 inches in internal diameter and 8 inches deep, equating to approximately 2,150 cubic inches or 32 US dry quarts. The standard TW, in pounds per bushel (lb/bu) for US No. 1 yellow corn is 56 lb, while No. 2 corn is 54 lb/bu.2
Test weight can directly impact how many bushels, by weight, that a grower is paid for at the grain terminal. For example, if a typical semi-load of 1000 bushels (by volume) of corn grain has a TW of 58 lb/bu, the grower would be paid for 58,000 pounds or 1035 bushels of No. 1 yellow corn. However, if the grain has a TW of only 52 pounds per bushel, it will equal 52,000 pounds, or 928 bushels, of No. 2 yellow corn. Grain buyers pay for “dry” bushels corrected to the standard moisture level of 15.5%. Corn that grades lower due to low TW may have a lower price per bushel by volume at the elevator.
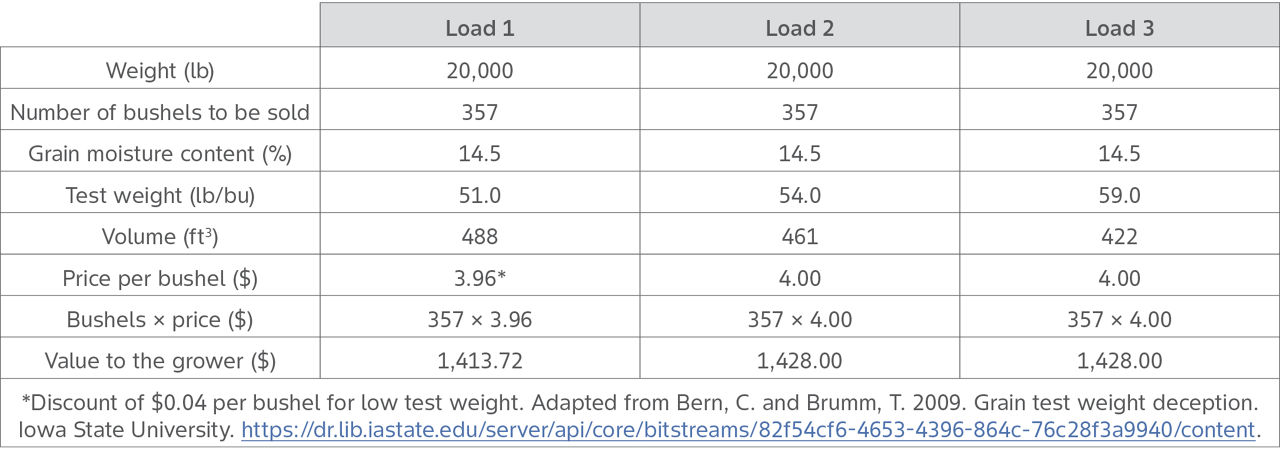
Table 1 illustrates the effect on the volume of corn grain represented by three hypothetical loads, each weighing 20,000 lb, with tests weights 51.0, 54.0, or 59.0 lb/bu at the same grain moisture content. (Note the 51 lb/bu test weight assumes a $0.04 discount on the price per bushel due to the low TW.)
The weight of the corn that the grower gets paid for is not affected by TW. Also note that the truck or trailer hauling load 3 would not be as full as loads 1 or 2, even though the total weight of each load is the same.
Table 1. Example calculation of corn value, with different test weights.
Why is test weight not highly correlated to corn grain yield?
As already stated, TW measures the weight of corn in pounds that can fit into a bushel, while yield is a direct measure of kernel weight and kernel number. Test weight is only partially related to kernel weight because of the volume component associated with the measurement. Factors that affect TW, but not corn yield, are those that influence how kernels fit or pack together—such as seed coat (pericarp) slickness, kernel shape, and size. Due to the volume component, TW influences how many bushels can fit into a bin, wagon, or truck, but does not influence bu/acre. For example, seed size may be reduced while the density of individual seeds remains unchanged.5
The genetic background of an individual corn product can have an impact on TW. Products that tend to have a higher vitreous (hard or flinty) endosperm can be higher density and, therefore, a higher TW compared to products with floury (soft or dent) endosperms. However, endosperm content does not necessarily correlate to differences in genetic yield potential. Two different corn products can be grown in the same environment and produce the same amount of dry matter (12,320 lb of dry matter/acre or 220 bu/acre), but one may have a higher TW because the higher TW product has less volume per 56-lb unit of grain.
Does grain moisture content affect the test weight of corn?
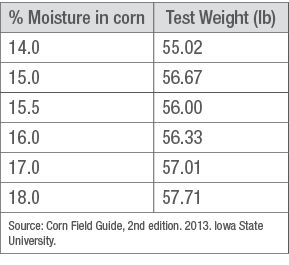
There is an inverse relationship between TW and the percent grain moisture content of the kernel. As the grain dries and moisture content decreases, TW increases (Table 2). Grain moisture content is by far the most influential factor affecting test weight.
In a study at the University of Illinois, five corn products were harvested at 30% grain moisture content and air dried in the laboratory, with moisture content monitored every few days. From about 30% down to 27 to 28% grain moisture, TW tended to drop by up to two pounds across the five corn products, presumably because the kernels lost moisture while nothing else changed. However, as grain moisture decreased from 25% to about 15%, test weights rose almost in a straight line. The increase in TW as grain moisture declined from 25% to 15% ranged from 5.3 to 7.7 pounds per bushel, with an average of 6.1 pounds per bushel. As grain moisture content dried to less than 15%, the rate of increase in TW slowed, and then eventually stopped as grain moisture dropped down to 10 to 11%. The loss of water from kernel starch usually results in the starch granules packing together more tightly, which increases kernel density and test weight. Compared to high grain moisture content, kernel size is reduced as the grain dries and the pericarp becomes “slicker”, allowing more kernels to pack tighter into a bushel (by volume), raising the TW.1,2,6
Table 2. The relationship between corn grain moisture content and test weight.
Several other factors that can result in lower TW include environmental stress, late-season foliar disease presence (e.g., gray leaf spot or northern corn leaf blight), or a frost/freeze prior to physiological maturity. This is because any reduction in the photosynthetic capacity of the corn plant may decrease the starch accumulation in the kernel, resulting in a lower test weight.1,2
Physiological Maturity and Corn Grain Drydown
Physiological maturity occurs when the amount of sucrose moving from the plant to the kernels is below a certain level. The cells at the connection compress and die, forming a “black” layer that blocks the movement of sucrose to the kernel. Normally this occurs when the plant reaches full maturity or growth stage R6, but loss of leaf tissue from hail, diseases (e.g., gray leaf spot), or frost can cause the black layer to form prematurely.
Under normal growing conditions, grain moisture content at black layer is about 30%, though this can vary depending on the corn product. The rate of in-field drydown is dependent on environmental conditions (especially temperature, humidity, and rainfall), corn product attributes, planting date, pest and disease impacts, and fertility deficiencies. The primary loss of kernel moisture is through the pericarp. Typical corn grain moisture content loss may range from 0.4 to 0.8 percentage points per day depending on environmental temperature and humidity but can be as low as 0.3 or greater than 1 percentage point. The standard estimate for drydown in the Corn Belt is the loss of 0.5 to 1.0 percentage point daily in September, a 0.25 to 0.5 daily percentage point loss in October, and almost zero loss in November. Maximum drydown rates occur in warm temperatures, low humidity, and windy conditions. As day length becomes shorter and average temperatures decrease, the rate of moisture content loss generally decreases. Consequently, corn maturing at the beginning of September should dry faster than corn that matures in October.7,8,9 No relationship has been established linking the rate of drydown to lower or higher test weight.
Several corn hybrid characteristics that have been identified as having an influence on grain drydown rates in the field include:
- Husk leaves. Fewer and thinner the husk leaves, and the looser the husk surrounding the ear, the more rapid the drydown.
- Husk leaf senescence. The sooner the husk leaves senesce, or die, the more rapid the grain moisture loss.
- Open husk at the ear tip. An open husk at the ear tip can aid in more rapid drydown.
- The angle of the ear on the stalk. Ears that remain upright after physiological maturity may capture and hold moisture.
- Pericarp thickness. Thinner kernel pericarps, or the outermost layer of a corn kernel, has been linked to faster drydown rates.
- Maturity date. Corn that reaches physiological maturity earlier in the fall usually has faster in-field drydown rates than later-maturing corn.7
Learn More About Corn Products from Bayer
Wondering what corn product characteristics would benefit your acres the most? Contact your local Bayer Agronomist or seed supplier today to learn more about selecting the right product to meet your needs. Or visit https://www.cropscience.bayer.us/brands/dekalb, https://www.cropscience.bayer.us/brands/channel.
Sources
1Nielsen, R.L. 2021. Grain test weight considerations for corn. Purdue University, Corny News Network. https://www.agry.purdue.edu/ext/corn/news/timeless/testweight.html
2Quinn, D. 2022. Making sense of grain test weight in corn. Purdue University, Pest&Crop Newsletter. https://extension.entm.purdue.edu/newsletters/pestandcrop/article/making-sense-of-grain-test-weight-in-corn/
3Lauer, J. 2002. Methods for calculating corn yield. University of Wisconsin, Agronomy Advice. Field Crops 28.47-33. https://corn.aae.wisc.edu/AA/A033.aspx
4Nielsen, R.L. 2021. Estimating corn grain yield prior to harvest. Purdue University, Corny New Network. https://www.agry.purdue.edu/ext/corn/news/timeless/YldEstMethod.html
5Bern, C. and Brumm, T. 2009. Grain test weight deception. Iowa State University Digital Repository. PMR 1005. https://dr.lib.iastate.edu/server/api/core/bitstreams/82f54cf6-4653-4396-864c-76c28f3a9940/content
6Nafziger, E. 2019. Wet grain, test weight, and late corn harvest. University of Illinois at Urbana-Champaign. https://farmdoc.illinois.edu/field-crop-production/uncategorized/wet-corn-grain-and-delayed-harvest.html
7Nielsen, R.L. 2018. Field drydown of mature corn grain. Purdue University, Corny News Network. https://www.agry.purdue.edu/ext/corn/news/timeless/GrainDrying.html
8Elmore, R. and Abendroth, L. 2007. How fast can corn dry down? Iowa State University Extension and Outreach, Integrated Crop Management. https://crops.extension.iastate.edu/encyclopedia/how-fast-can-corn-dry-down
9Thomison, P. 2019. Drydown in corn – What to expect? Ohio State University Extension, C.O.R.N. Newsletter. 2019-32. https://agcrops.osu.edu/newsletter/corn-newsletter/2019-32/drydown-corn-%E2%80%93-what-expect
Web sources verified 9/25/26. 1214_152002.
Disclaimer
ALWAYS READ AND FOLLOW GRAIN MARKETING AND ALL OTHER STEWARDSHIP PRACTICES AND PESTICIDE LABEL DIRECTIONS.