7 MIN READ
Corn Yield Response to Crop Inputs
May 16, 2023
Trial Objective
Additional crop inputs can always be added to a corn production system, but it is important to know which ones have the biggest impact on yield. Being able to compare the yield from various inputs and the costs associated with the inputs provides a means to decide the potential return on investing in specific inputs to boost corn yields.
The objective of this study was to evaluate how corn yield is influenced by six different inputs added to a corn system, including adding each one to a base treatment or subtracting one from a treatment with all other inputs included.
RESEARCH SITE DETAILS
| Location | Gothenburg, NE |
| Soil Type | Hord silt loam |
| Previous Crop |
Soybeans |
| Tillage Type |
Strip-tillage |
| Planting Date | 04/30/21 |
| Harvest Date | 11/08/2021 |
| Potential Yield (bu/acre) |
300 |
| Seeding Rate (seeds/acre) |
32K & 40K |
A 109 RM VT Double PRO® RIB Complete® corn blend was selected for the trial based on proven high yield potential.
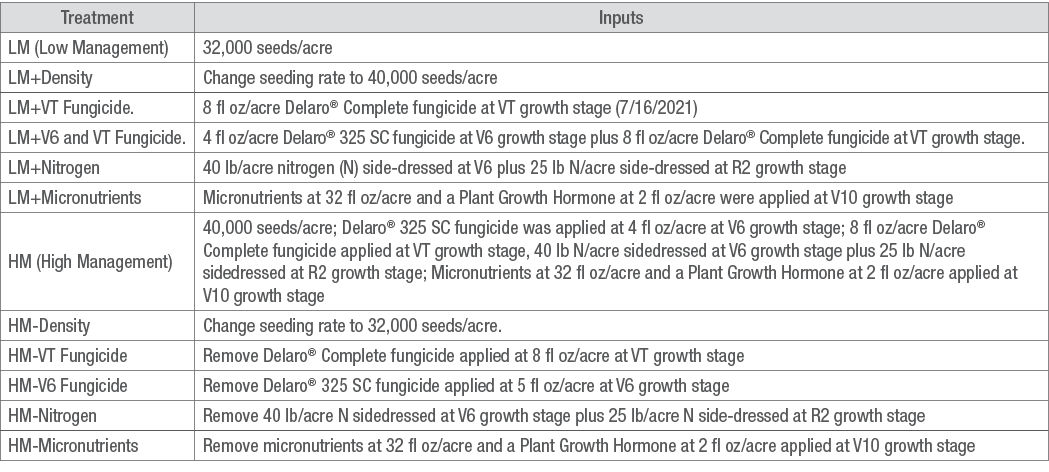
The study was a randomized complete block design with four replications and twelve management treatments (Table 1).
Weeds were controlled uniformly across the study with an application of 32 fl oz/acre Roundup PowerMAX® Herbicide, 5 fl oz/acre Corvus® herbicide, 2 pt/acre Harness® Herbicide, and 1 qt/acre Atrazine 4L on May 4, 2021.
A base fertilizer application of 30 lb nitrogen (N)/acre, 60 lb phosphorus (P)/acre, 25 lb sulfur (S)/acre, 0.25 lb zinc (Zn)/acre was strip-tilled across all treatments on April 23, 2021.
A base application of 150 lb N/acre was applied with streamer bars on May 8, 2021.
A total of 9 inches of irrigation was applied to meet the evapotranspiration needs of the crop.
Stalk lodging and final stand counts were taken just prior to harvest.
Plots were combine-harvested. Grain moisture content, test weight, and total weight were determined. Statistical analysis for Fisher’s LSD was performed.
Table 1: Site Soil Test Information


Table 2. Management treatments

UNDERSTANDING THE RESULTS

Impact on Yield
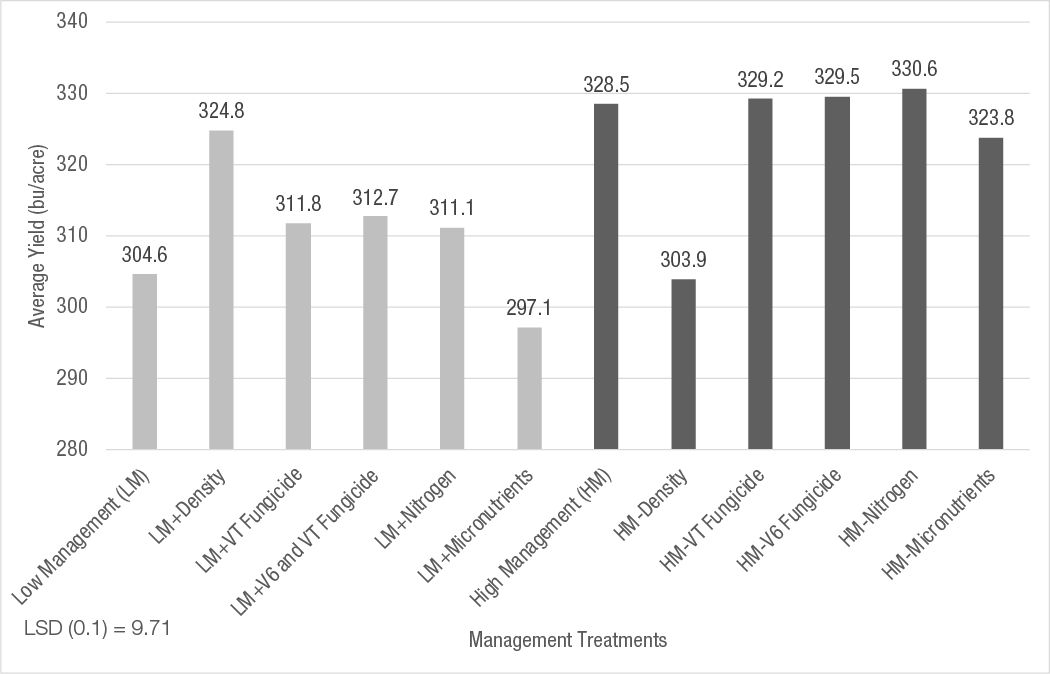
- Comparing the two systems, the low management (LM) system yielded about 24 bushels per acre less than the high management (HM) system. Most of the increase in yield resulted from the increase in the seeding rate from 32,000 to 40,000 seeds per acre with the HM system (Figure 1).
- The additional seeds per acre improved yield 20 bushels per acre when comparing the yield of the LM treatment to the LM + Density treatment where seeding density was increased.
- High management treatments responded similarly across all treatments except when seeding rate was decreased in the HM-Density treatment. The yield difference comparing the decreased density treatment to the other HM treatments was approximately 25 bushels per acre.
- At $5.00 per bushel corn and a seed cost of $300 per 80K unit, the return on spending an extra $30.00 per acre on seed was over $100 dollars per acre in grain yield, which is very impactful.
- Other treatments such as the application of Delaro® 325 SC fungicide and Delaro® Complete fungicide, and extra nitrogen added additional yield to the LM treatment, but the increases were not significant at the P>0.1 significance level.
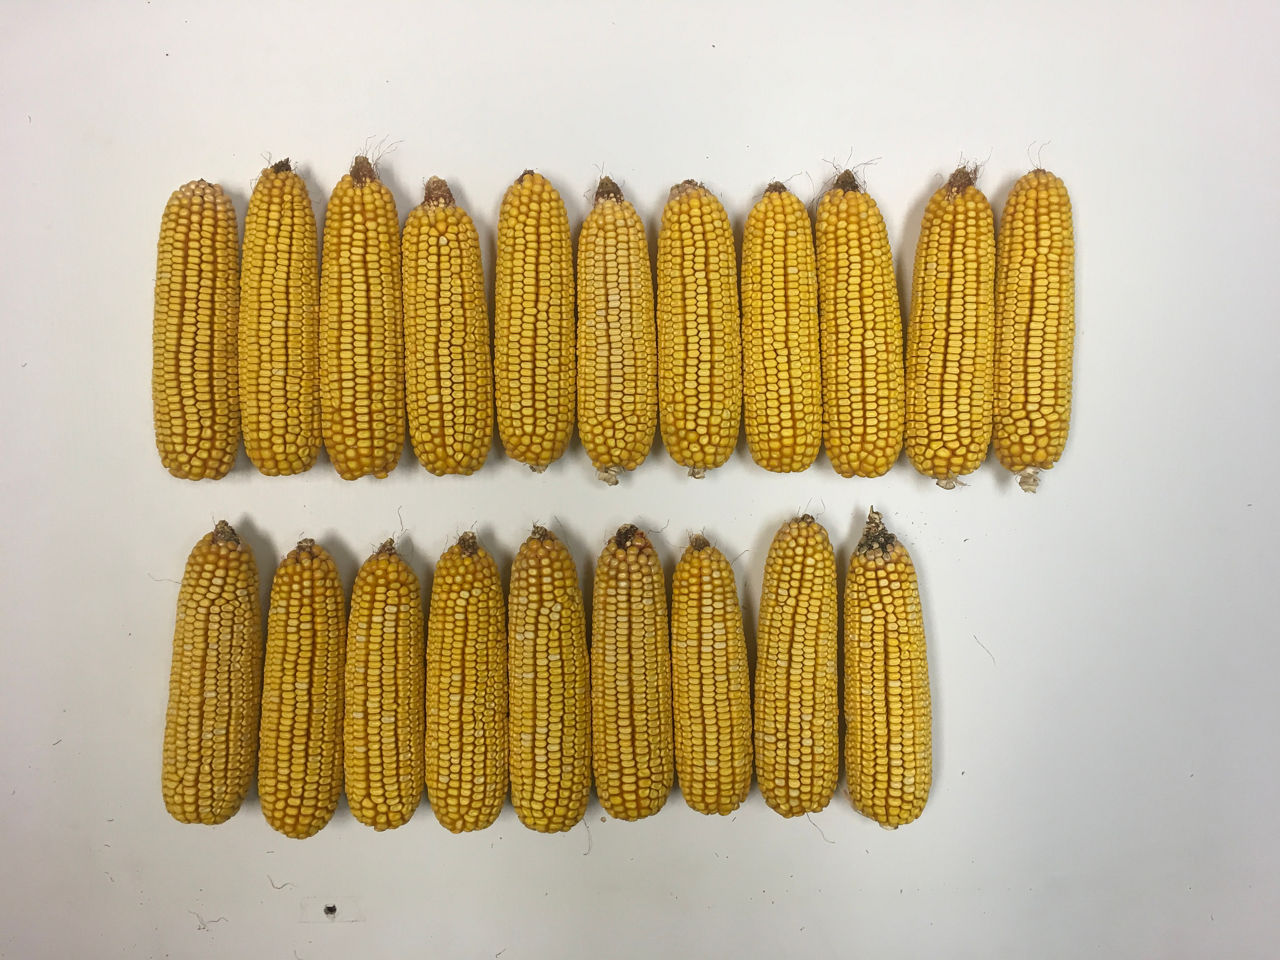
- Figure 2 shows corn ears gathered in 5 feet of 30-inch rows from different treatments in the study. The different ear sizes illustrate the impact of increasing seeding rate on ear development. The corn product in this study showed very good ear size at both seeding rates, but 2 additional ears were present in 5 feet of row at the 40,000 seeds/acre seeding rate.


Test Weight
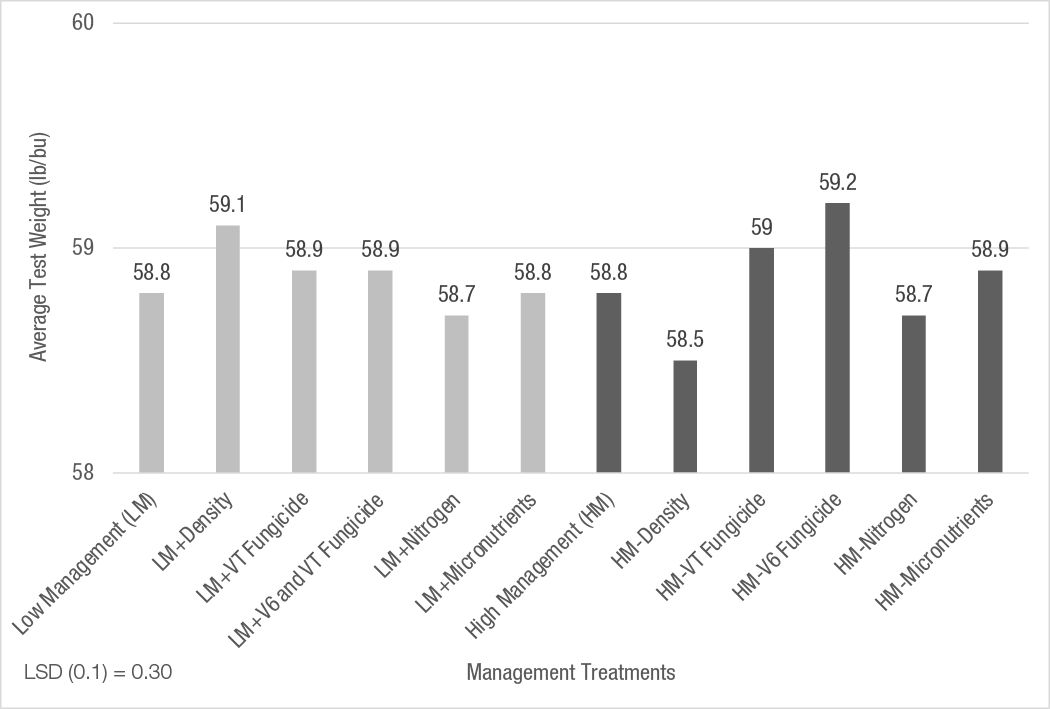
Test weight only had a treatment range of 0.7 bu/acre over the entire trial, but there was some variation among the treatments (Figure 3).
Test weight was improved when the seeding rate was increased in the LM+Density treatment, but other input additions to the LM treatment did not change the grain test weight then compared to LM.
- The HM treatment test weight was decreased when decreasing the seeding rate from the HM to the HM-Density treatment. Test weight was improved by removing the V6 fungicide application (HM-V6 Fung) compared to the HM treatment.
KEY LEARNINGS
Increasing the seeding rate from 32,000 seeds per acre to 40,000 seeds per acre had a large impact on yield and potential profitability with the corn product evaluated in this trial environment.
One of the main concerns with increasing seeding rates is late season stalk lodging. However, no differences were seen in stalk lodging ratings in this study, and plants in all treatments averaged just under 1.5 on the rating scale (data not shown).
An average 24 bu/acre yield increase was recorded for the High Management treatment with no additional inputs compared to the Low Management treatment with no additional inputs.
Carefully weighing the cost of additional inputs to the expected returns is important in making economical decisions on the levels of management inputs, as grain prices and input prices fluctuate.
1017_R14