Dryland Corn Production Decisions Impact on Potential Yield and Profit
June 10, 2024
TRIAL OBJECTIVE
- Testing dryland production systems is crucial to understanding how to manage corn under environmental conditions to meet the farmer’s needs and achieve a successful outcome.
- The objective was to establish a long-term study of how management practices (i.e., cover crops, crop rotation, maturity selection, planting rate, and tillage practices) influence productivity in tough dryland environments.
RESEARCH SITE DETAILS

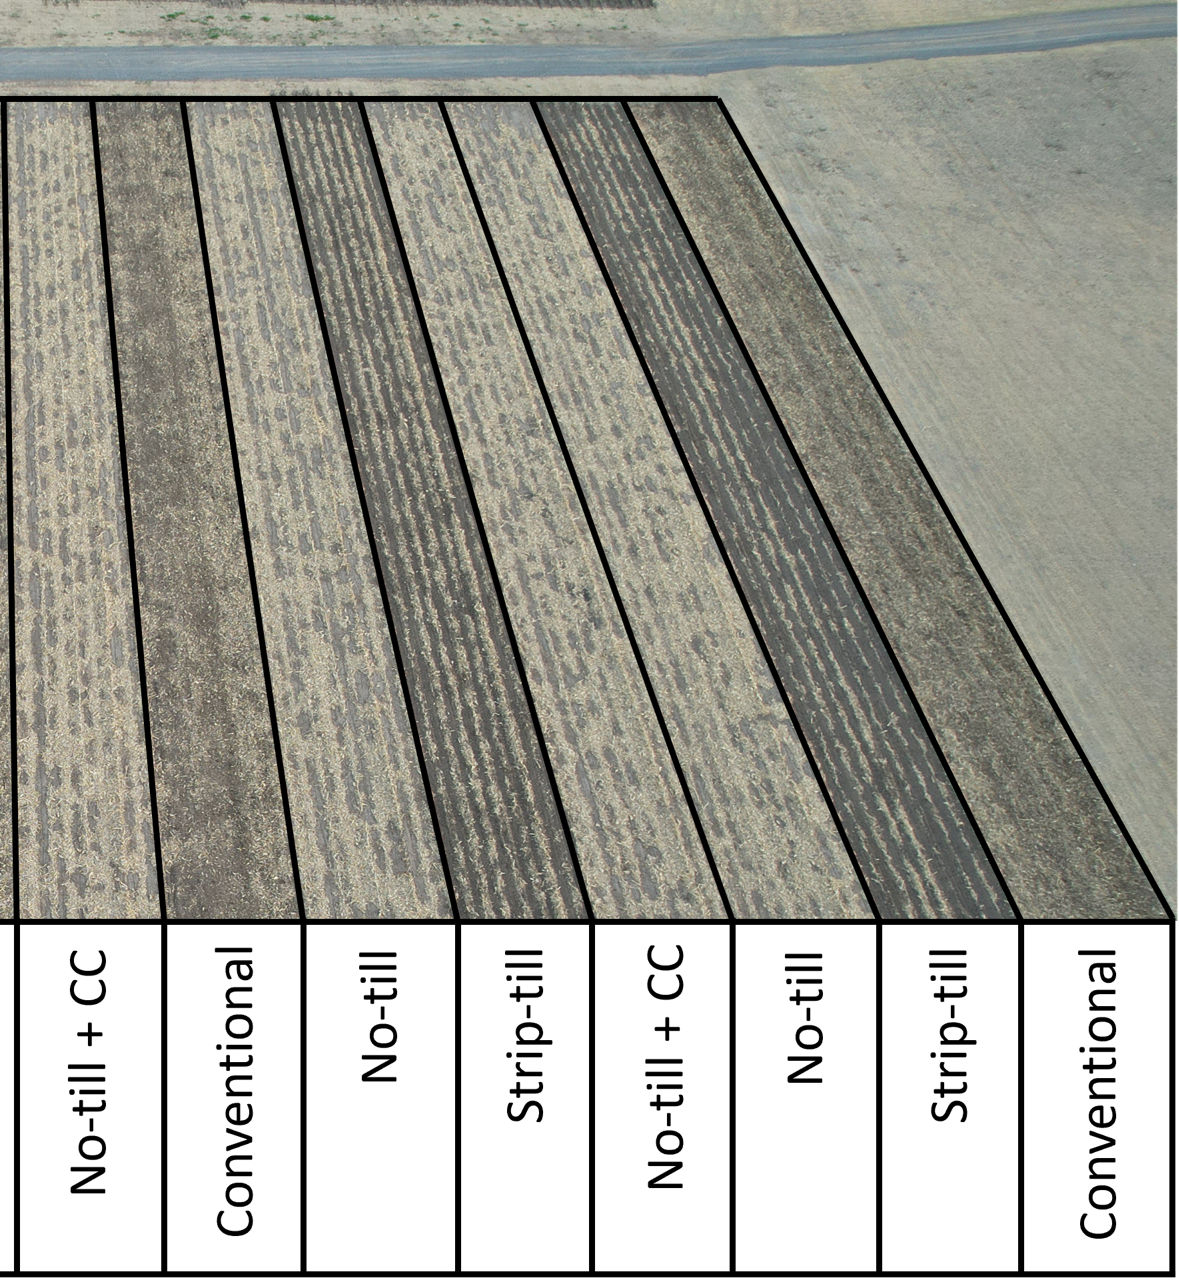
- The trial was arranged as a split-split plot with tillage as the main plot and corn product as the sub-plot. The trial had two replications, four tillage systems, four corn products with relative maturities (days) of 95, 103, 109, and 115, and two planting rates (seeds/acre).
- A rye cover crop was planted in early spring of 2023. However, establishment of the cover crop prior to planting the corn was poor.
- Tillage treatments were completed on 05/02/2023 with 29 lb nitrogen/acre, 60 lb phosphorus/acre, and 25 lb sulfur/acre incorporated through strip-tillage, surface applied for no-till, or incorporated in conventionally tilled treatments.
- The corn products were planted on 05/04/2023 at 16,000 and 24,000 seeds/acre into 70 x 10 ft plots on a 30-inch wideow spacing.
- On 05/30/2023, pre-emerge herbicides were applied consisting of Roundup PowerMAX® 3 Herbicide (30 fl oz/acre), Atrazine 4L Herbicide (32 fl oz/acre), Harness® Herbicide (32 fl oz/acre), Balance® Flexx herbicide (5 fl oz/acre), and DiFlexx® herbicide (8 fl oz/acre).
- On 06/15/2023, a sidedress application of 32-0-0 was applied at a rate of 120 lb nitrogen/acre.
- On 06/15/2023, post emergence herbicides were applied consisting of Laudis® herbicide (3 fl oz/acre), Atrazine 4L Herbicide (32 fl oz/acre), Harness® Herbicide (24 fl oz/acre), and DiFlexx® herbicide (12 fl oz/acre).
- Final stand counts, intactness ratings, lodged plants, and ear height were measured at harvest time.
- The total rainfall accumulated during the 2023 corn-growing season was 13.5 inches.
- Study was harvested on 09/18/2023 for total plot weight, test weight, and moisture content.

UNDERSTANDING THE RESULTS
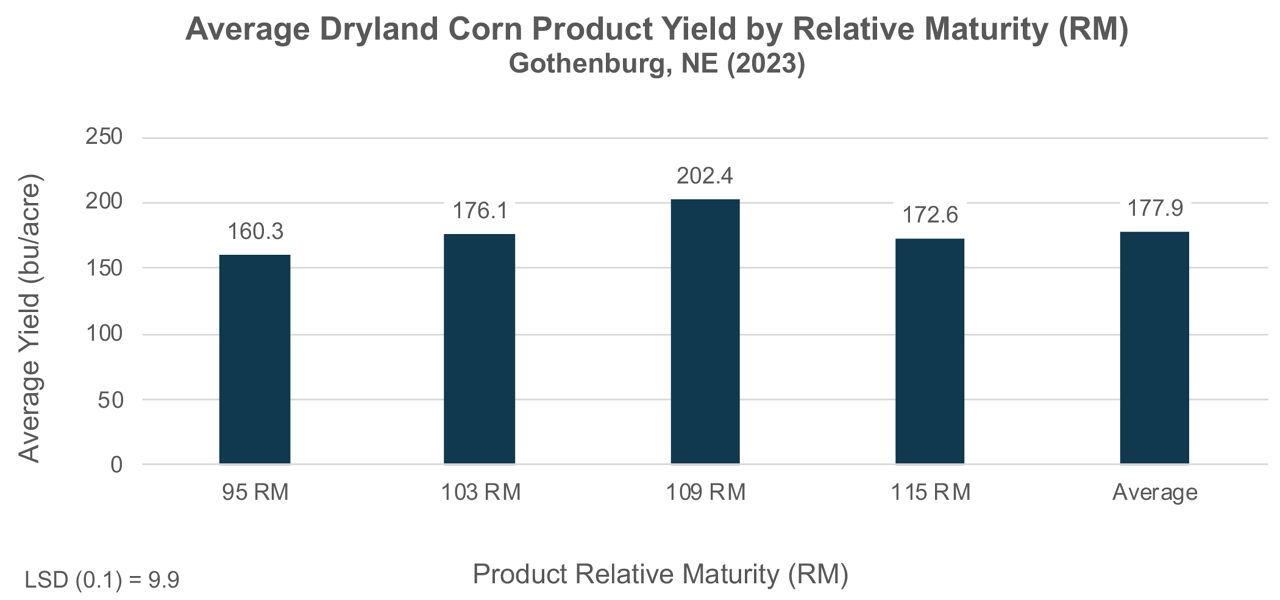
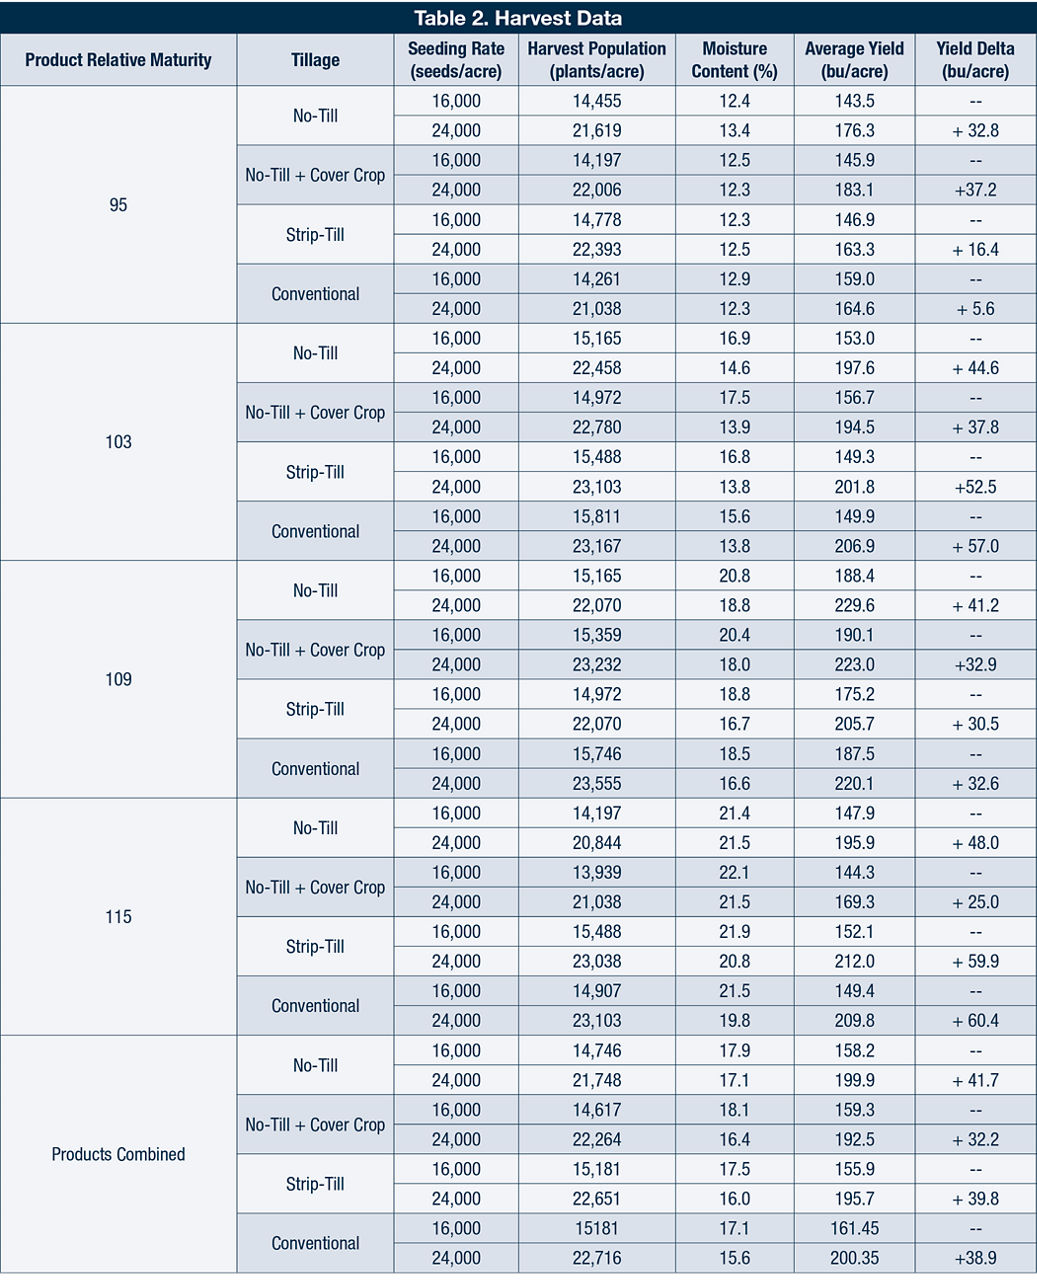
- At an average of 202.4 bu/acre, the 109 RM product had the highest yield of any corn product (Figure 2). Compared to the other products in this study the 109 RM product was 42.1, 26.3, and 29.9 bu/acre greater than the 95 RM, 103 RM, and 115 RM products, respectively.
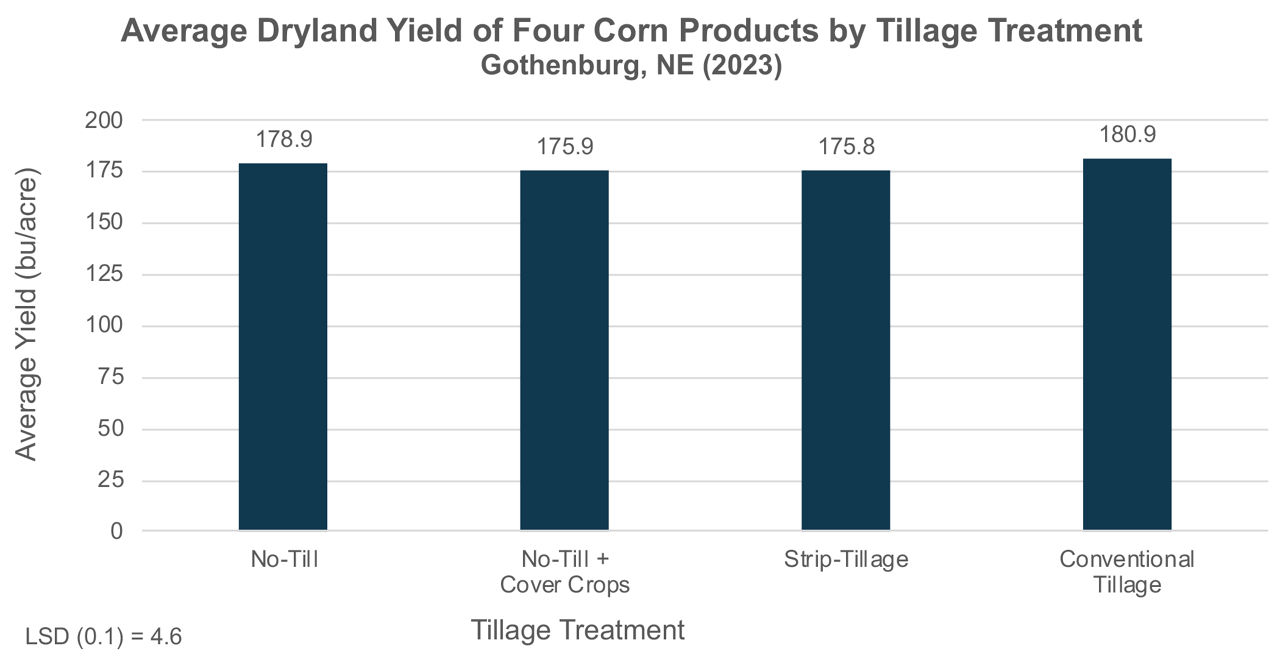
- The conventional tillage treatment averaged the highest overall yield at 180.9 bu/acre (Figure 3). This was not significantly different compared to the no-till treatment (178.91 bu/acre). Conventional tillage treatments did have a significant yield advantage over no-till + cover crop and strip-till treatments averaging greater than 5 bu/acre more.
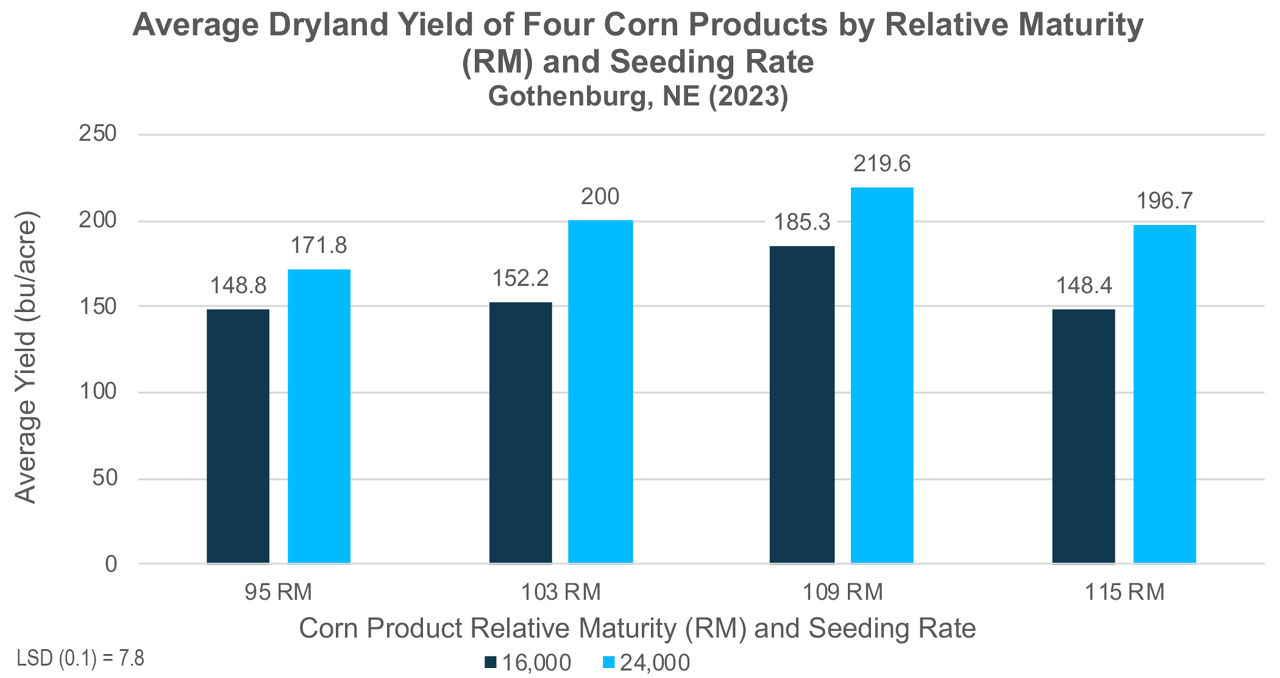
- Increasing seeding rates from 16,000 to 24,000 seeds/acre provided a significant yield increase of 38.3 bu/acre averaged across the four products. (Figure 4)
- Except for the 95 RM product, treatments seeded at 24,000 seeds/acre were one to two percent drier at harvest than the 16,000 seeds/acre treatments (Table 2).
- Based on an average seed cost of $325/unit of seed (1 unit = 80,000 seeds), the cost of the seeding rate, and a $4.00/bu cash price, the increase in profitability was $120.90/acre for seeding at 24,000 seeds/acre instead of 16,000 seeds/acre when averaging the treatments (Table 3).

KEY LEARNINGS
- This study demonstrates a minor increase in seed cost can provide an exponential return on investment in tough acre situations.
- Tillage seemed to have little effect on the average corn yield in 2023.
- The 109 RM corn product was favored in 2023, but climate and weather conditions may change that outcome depending on the growing season.
- Product selection and placement for dryland environments is critical; therefore, please contact your local Bayer seed provider for local recommendations.
- This research will be continued in 2024 and will include continuous corn and rotated soybean-corn treatments.
1210_397200
Disclaimer
Always read and follow pesticide label directions, insect resistance management requirements (where applicable), and grain marketing and all other stewardship practices.