Dryland Corn Production Management Decisions on Different Rotation Scenarios
June 17, 2025
TRIAL OBJECTIVE
- Seeding rate is a critical factor in dryland corn production, influencing competition for limited water resources and overall yield potential.
- Corn maturity group affects the crop’s growth duration and timing of water demand, which can greatly impact crop performance under limited moisture conditions.
- Tillage practices influence soil moisture retention, residue management, and seedbed conditions, while also affecting nutrient cycling and weed dynamics in dryland systems.
- Crop rotation history can alter nutrient availability, pest and disease pressure, and overall system productivity under water-limited conditions.
- The objective of this study was to evaluate the effects of seeding rate, corn maturity group, tillage system, and crop rotation history on corn performance under dryland conditions, with a focus on identifying management practices that may enhance yield stability.
RESEARCH SITE DETAILS

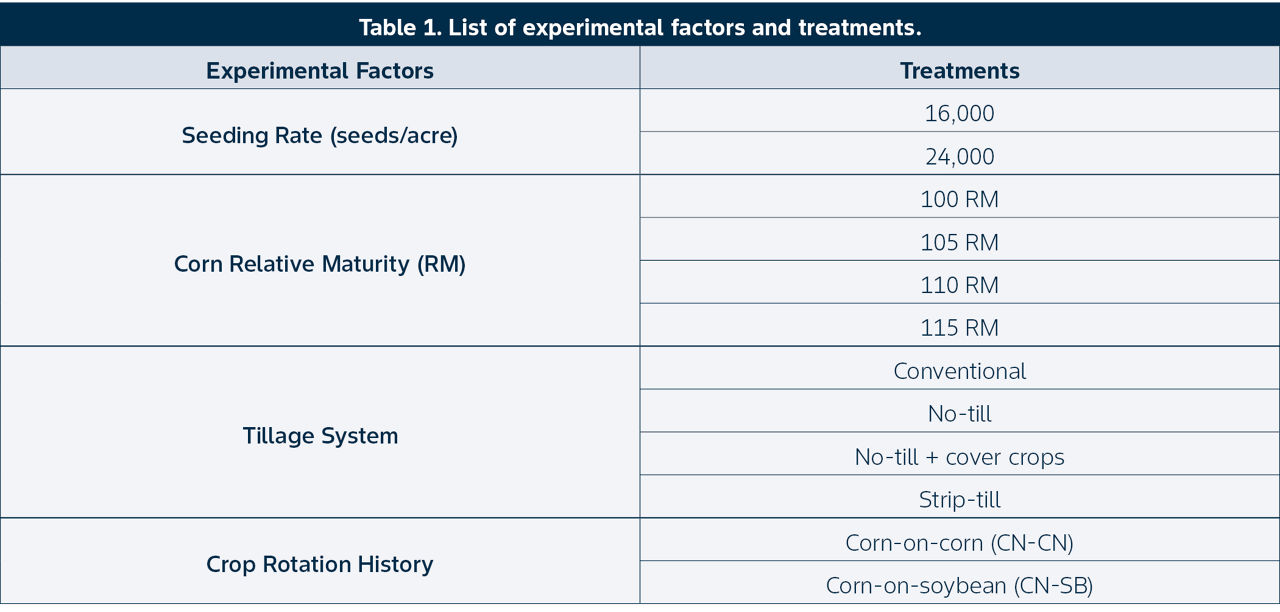
- The trial design was a randomized complete block split-plot design. The four experimental factors included seeding rate, corn Relative Maturity (RM), tillage, and crop rotation history (Table 1). One corn product was planted per RM.
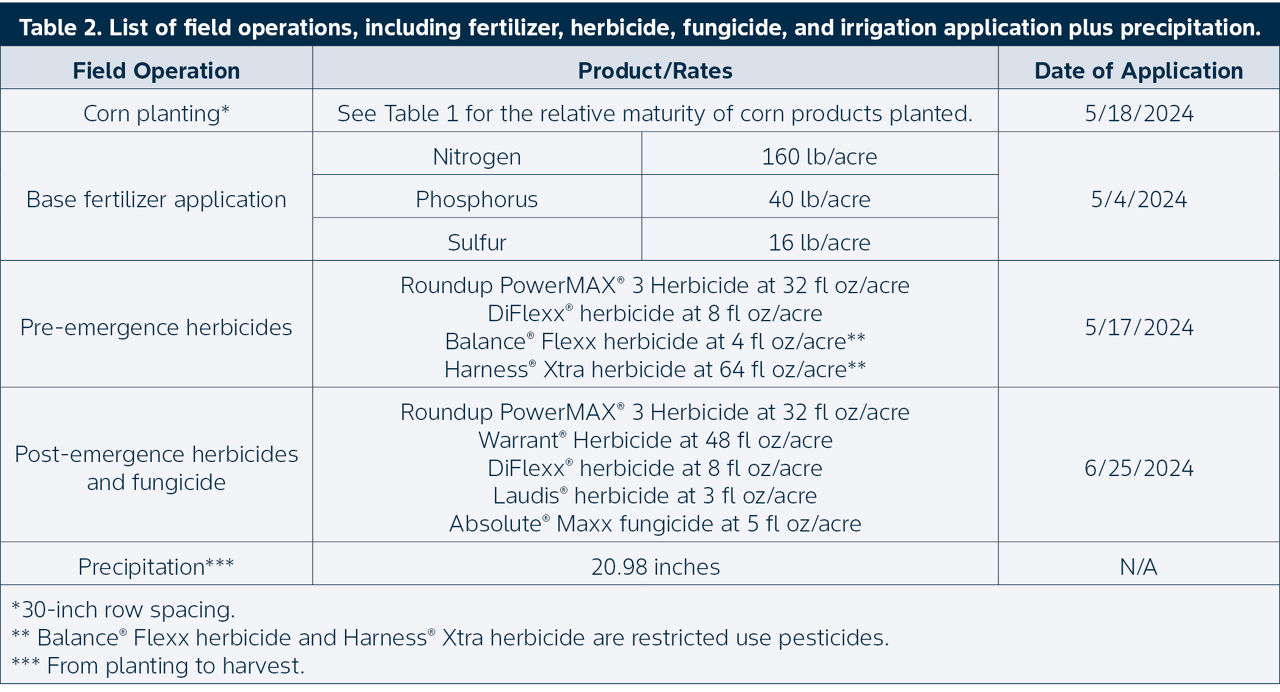
- Field operations, planting date, fertilizer, herbicide, fungicide, and precipitation information are listed in Table 2.
- Grain weight, test weight, and percent grain moisture content for each plot were collected with a small plot combine and used to calculate yield (bu/acre).
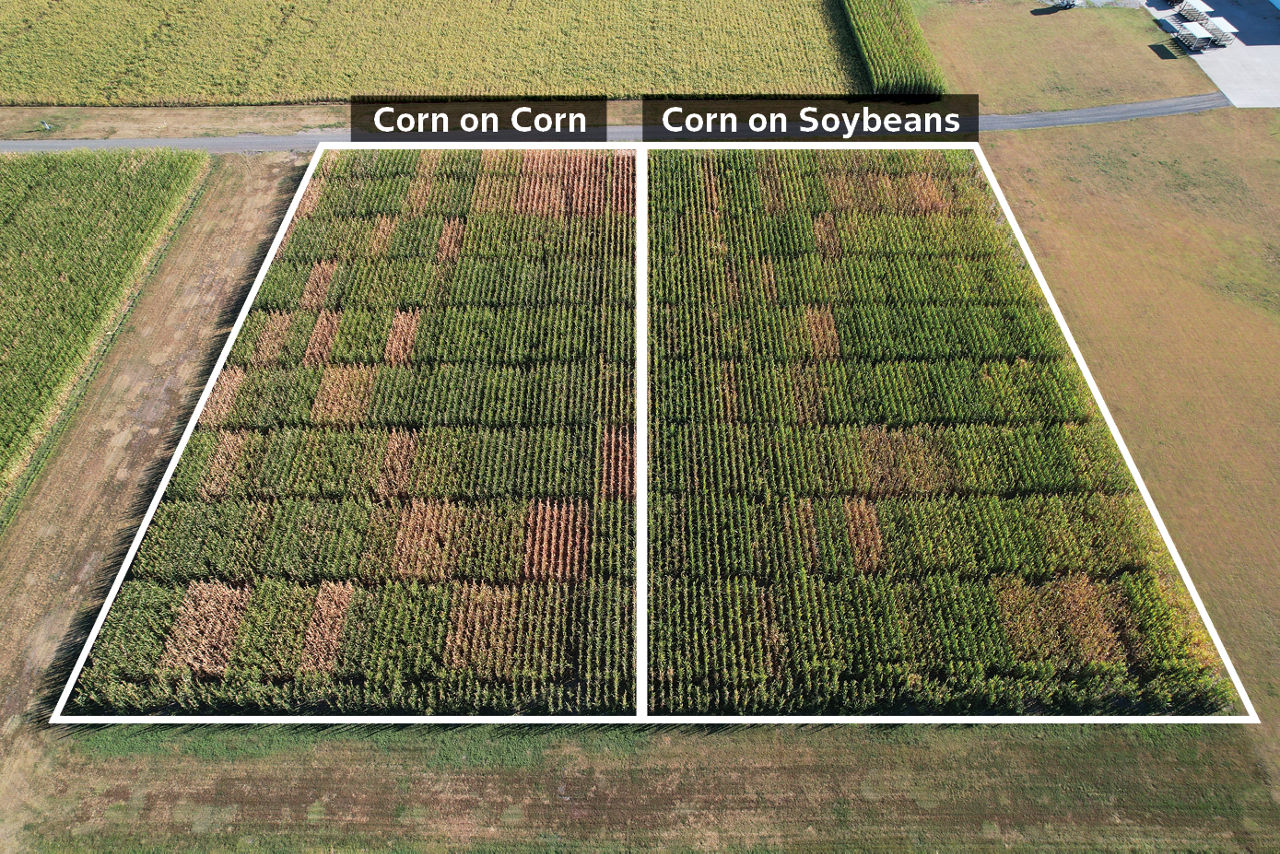
- Crop rotation history (corn-on-corn and corn-on-soybean) was divided into two separate fields (Figure 1) and analyzed separately.
- Statistical analysis using Fisher’s least significant difference (LSD) was performed on the data.
UNDERSTANDING THE RESULTS
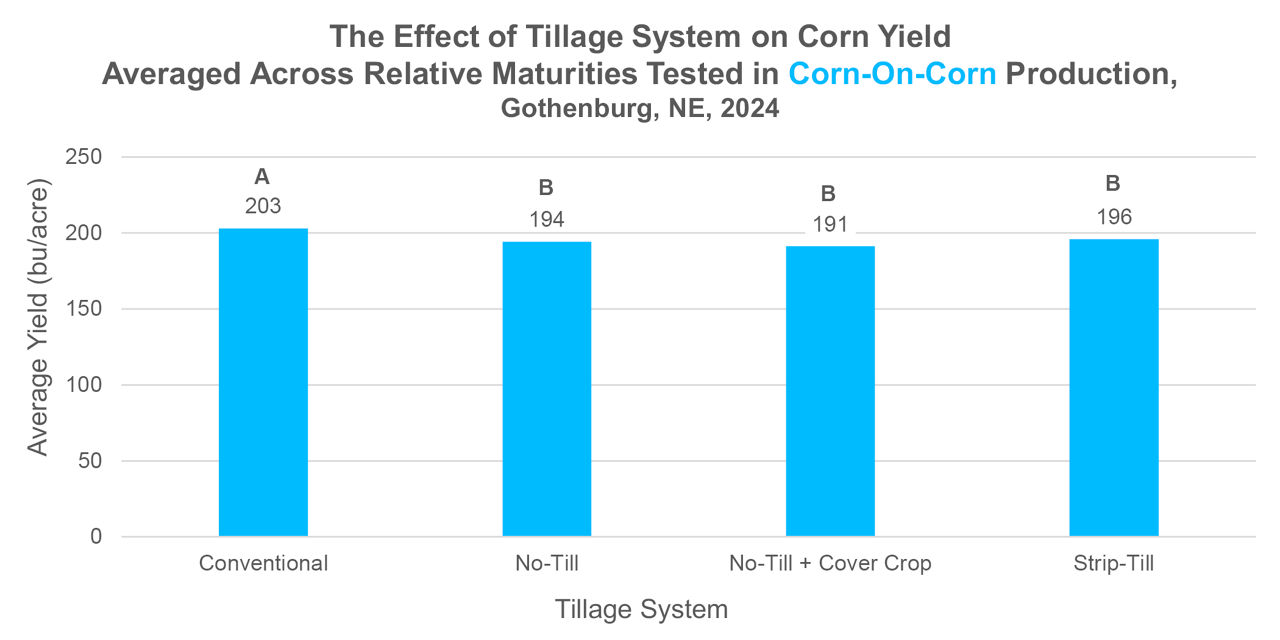
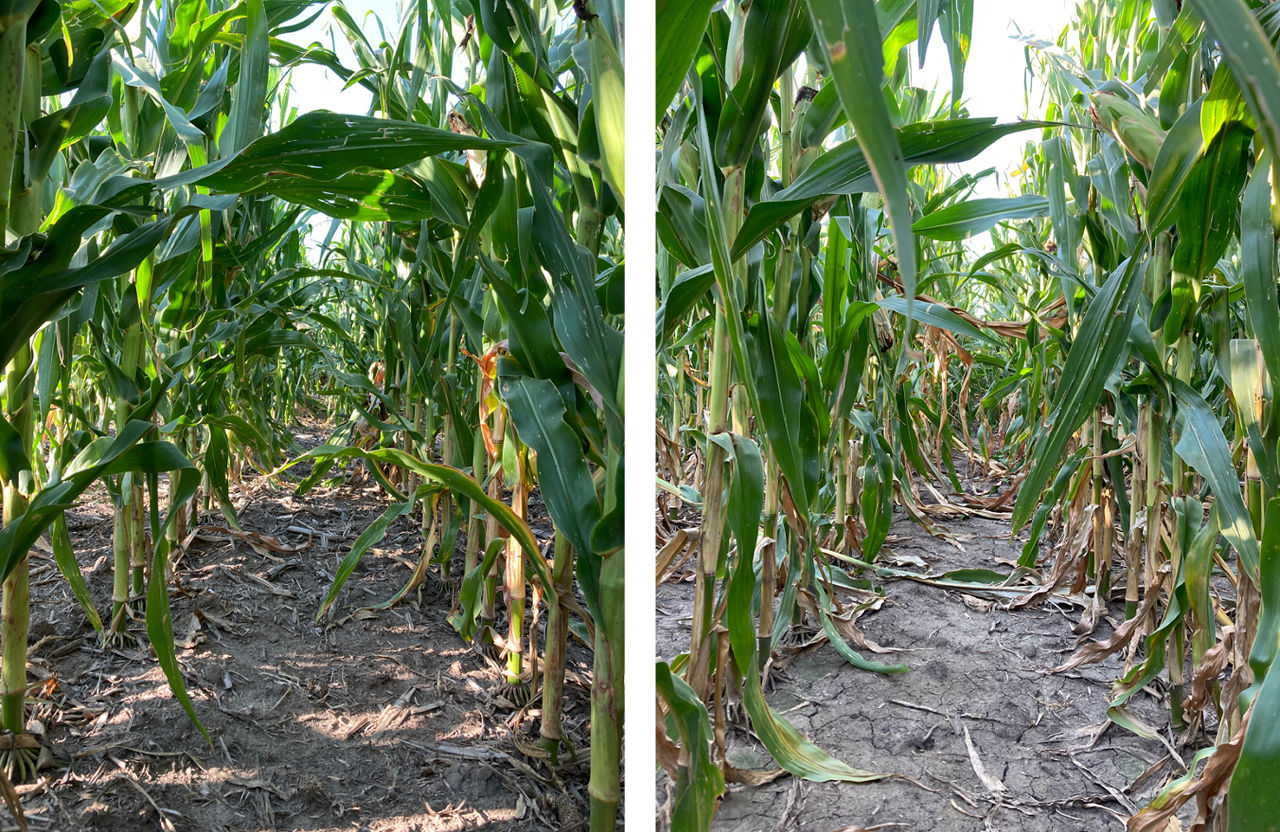
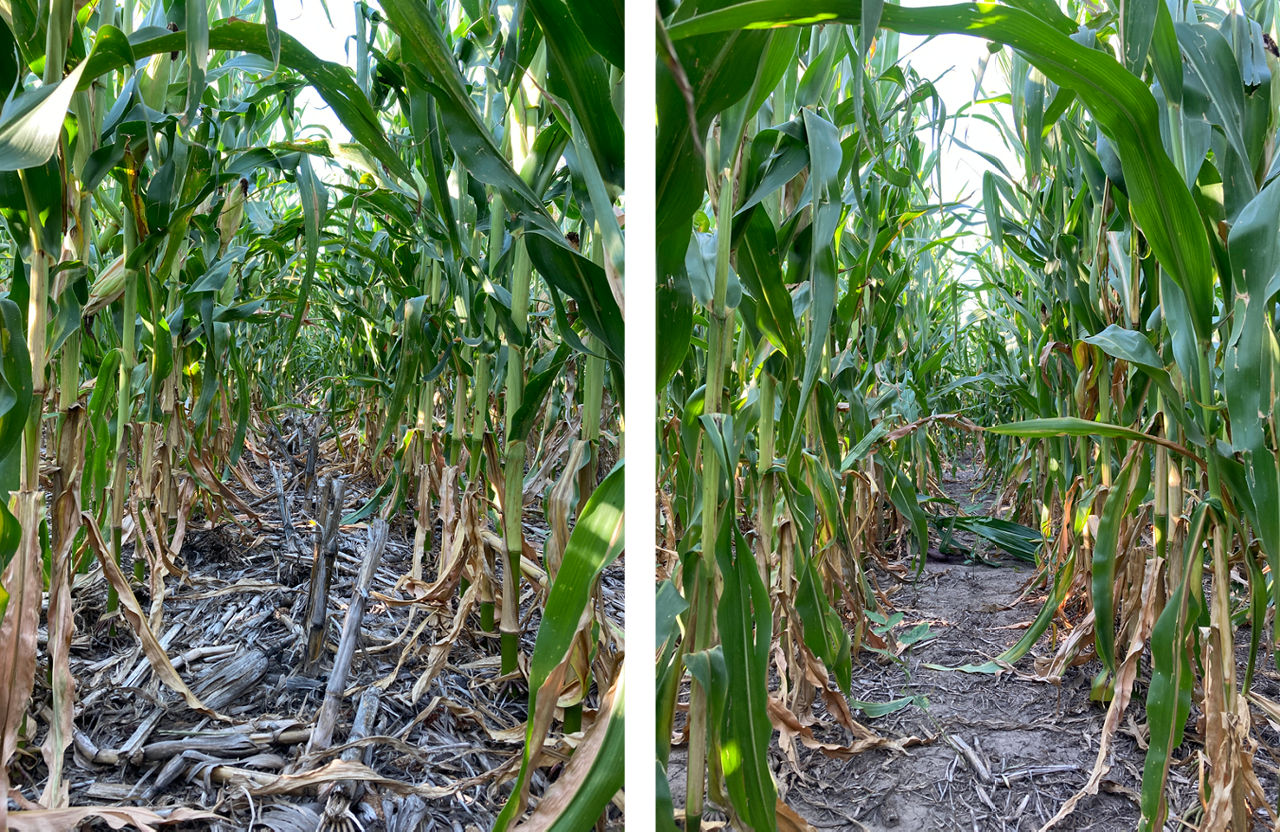
- In the corn-on-corn system, average yields were significantly higher under conventional tillage, likely due to reduced residue and improved seedbed conditions at planting. All other systems—No-Till, No-Till + CC, and Strip-Till—yielded less in this trial and were statistically similar (Group B), with the lowest yield observed in No-Till + Cover Crop (191 bu/acre).
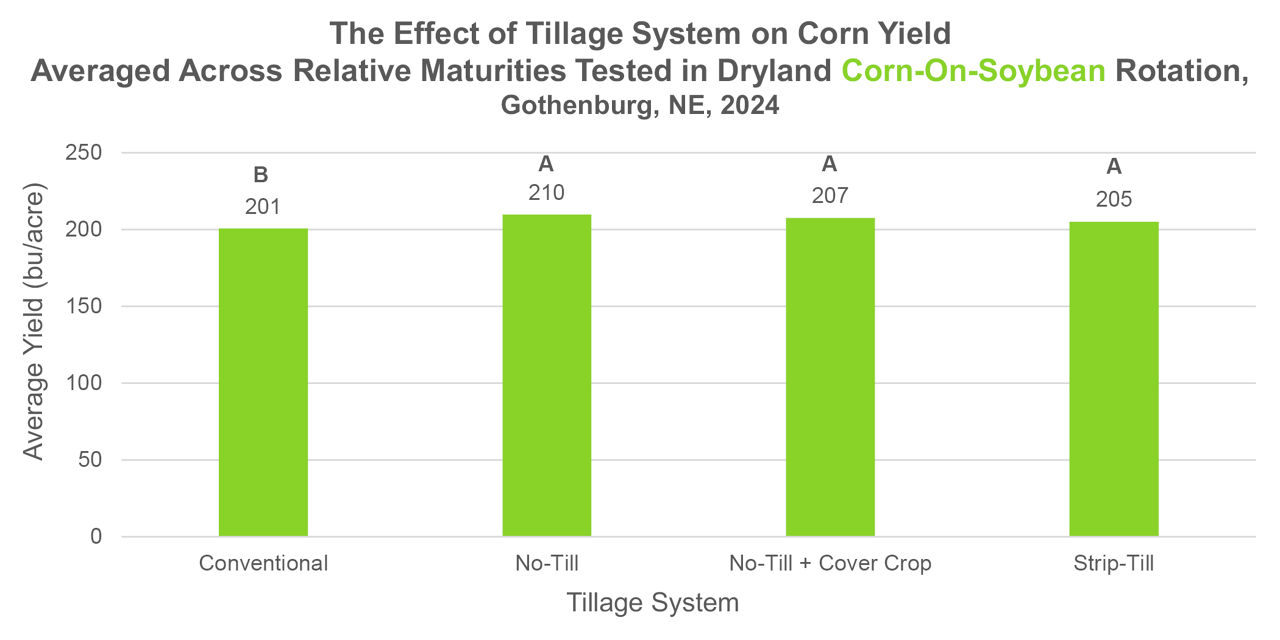
- In the corn-on-soybean rotation, the trend reversed. No-Till (210 bu/acre), No-Till + Cover Crop (207 bu/acre), and Strip-Till (205 bu/acre) had the highest and statistically similar yields (Group A), outperforming conventional tillage (201 bu/acre, Group B).
- These results highlight an interaction between residue levels and rotation history. Conventional tillage may benefit corn-on-corn systems, while higher-residue tillage practices appear more favorable for a corn-on-soybean rotation.
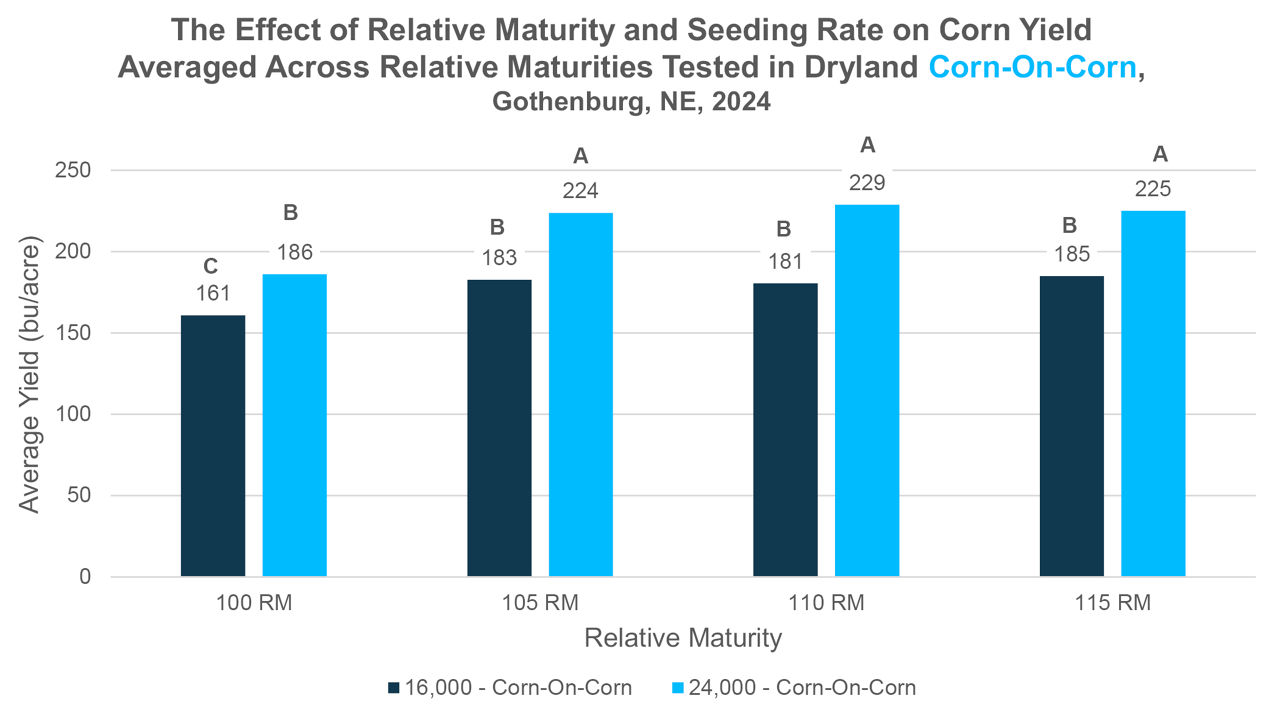
- The higher seeding rate in this study (24,000 seeds/acre) consistently outperformed the lower seeding rate (16,000 seeds/acre) across the four maturity groups tested.
- The 105, 110, and 115 RM corn products had significantly higher yields than the 100 RM product, indicating an advantage for planting later-maturing corn products under these conditions.
- For dryland corn-on-corn systems, planting a higher seeding rate (24,000 seeds/acre) and selecting corn products with relative maturities ranging from 105 to 115 may offer a higher yield potential (Figure 7).
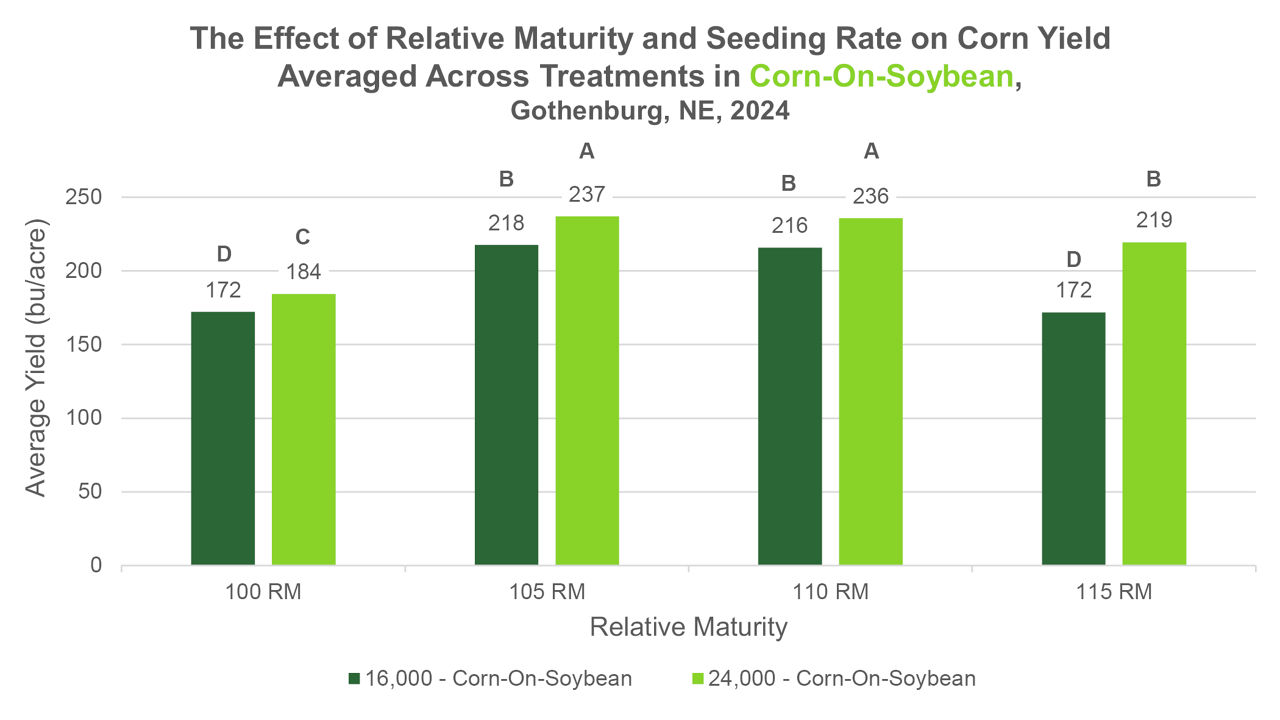
- The higher seeding rate (24,000 seeds/acre) consistently outperformed the lower seeding rate (16,000 seeds/acre) across the four maturity groups, showing a clear yield advantage.
- The corn products that were 105 RM and 110 RM produced the highest yields, especially at the higher seeding rate, suggesting these groups are better suited for maximizing yield potential in corn-on-soybean systems.
- The results indicate that combining longer-maturity corn products (105-110 RM) with higher seeding rates is an effective strategy to help maximize yield potential in dryland corn planted after soybean.
KEY LEARNINGS
- In this trial, conventional tillage benefited corn-on-corn systems, while conservation tillage practices were more favorable for corn-on-soybean rotations. This is likely due to improved residue management in corn-on-corn, where conventional tillage creates a cleaner seedbed by reducing corn stalk interference at planting and emergence.
- In this trial, longer maturity corn products outperformed the 100 RM product in both corn-on-corn and corn-on-soybean rotations. This is likely attributed to favorable rainfall conditions during the season (20.98 inches), which provided the additional moisture needed to support grain fill and full crop maturity in dryland systems.
- A seeding rate of 24,000 seeds/acre in this trial significantly outperformed 16,000 seeds/acre, indicating that 16,000 seeds/acre may fall well below the optimal threshold for this environment—particularly in a year with favorable rainfall.
- When selecting tillage practices, corn product maturity, and seeding rate, growers should consider the rotation history and expected moisture availability. Aligning these management decisions with local conditions can help optimize yield potential, especially in dryland systems where residue levels and water use efficiency play a critical role.
1110_562100