Dryland Soybean Yield Responses to Agronomic Management Practices
July 1, 2024
TRIAL OBJECTIVE
- Identifying good management practices is very important for maximizing yield potential in low-rainfall environments, particularly in unirrigated fields.
- The objective of this study was to determine the impact of tillage types (conventional, strip-till, no-till, and no-till plus cover crop), seeding rate, and maturity group on yield in Bayer products in a dryland soybean system.
- This soybean study was completed in conjunction with similarly designed corn study.
RESEARCH SITE DETAILS

- The trial was arranged as a strip-split plot with two replicates, four tillage systems, four soybean products, and two planting populations.
- Rye was planted as a cover crop in early spring 2023, but there was a poor stand establishment.
- Tillage treatments were performed on 05/02/2023 with 29 lb nitrogen/acre, 60 lb phosphorus/acre, and 25 lb sulfur/acre. Fertilizer applications were either incorporated with strip-tillage or surface applied for no-till and conventionally tilled treatments.
- Soybeans were planted on 05/05/2023 into 67.5 x 10 ft plots.
- On 06/14/2023, a post-emerge herbicide mix was applied with 22 fl oz/acre XtendiMax® Herbicide with VaporGrip® Technology (a restricted use pesticide), 48 fl oz/acre Warrant® Herbicide, and 30 fl oz/acre Roundup PowerMAX® herbicide.
- The total rainfall accumulated during the 2023 growing season was 13.5 inches.
- Total weight, test weight, and moisture content were collected with a plot combined on 09/24/2023, and average yield per acre was calculated later.
XtendiMax® herbicide with VaporGrip® Technology has been classified as a restricted use pesticide and must be used with VaporGrip® Xtra Agent (or an equivalent volatility reduction adjuvant). For approved tank-mix products (including VRAs and DRAs), nozzles and other important label information visit XtendiMaxApplicationRequirements.com. Applicators must check XtendiMaxApplicationRequirements.com no more than 7 days before application of this product for additional labeling, including state restrictions. Where applicable, users must comply with additional requirements found on this website.
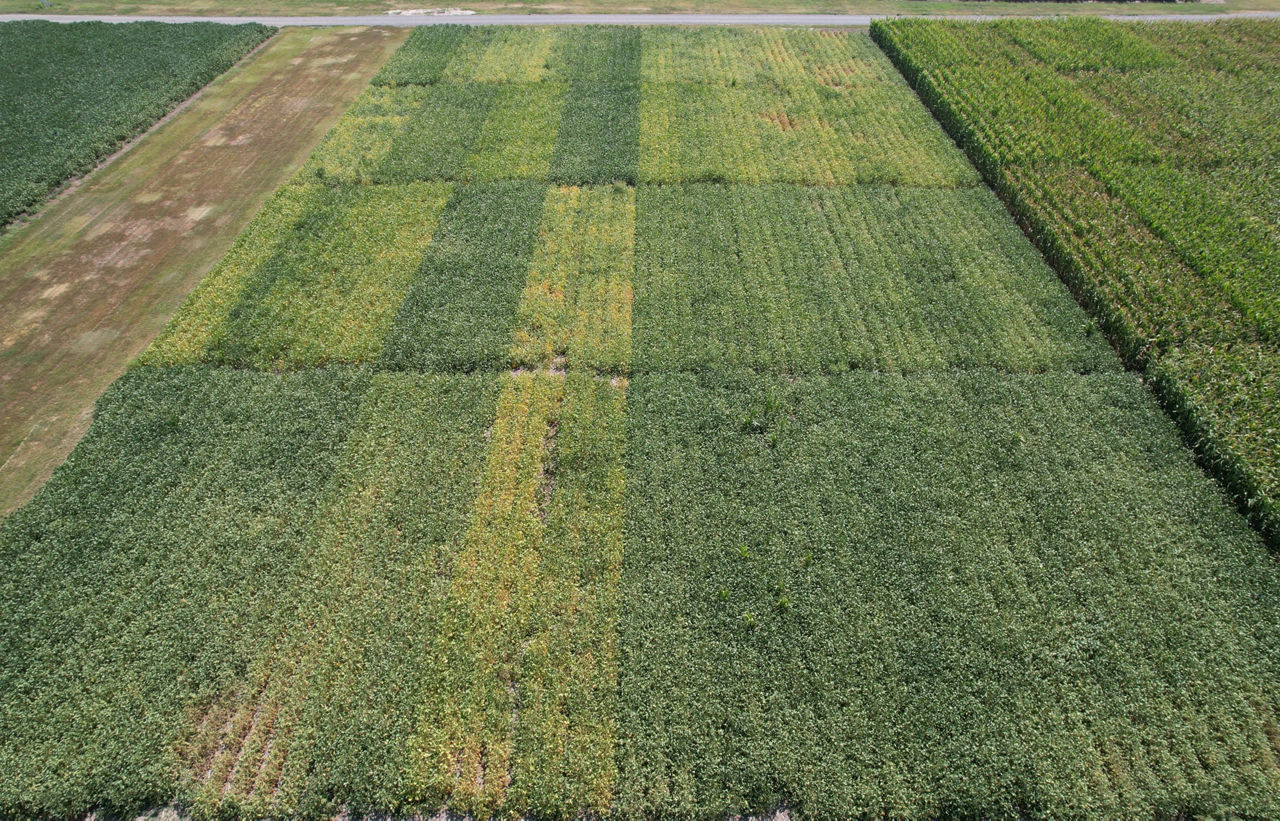
UNDERSTANDING THE RESULTS
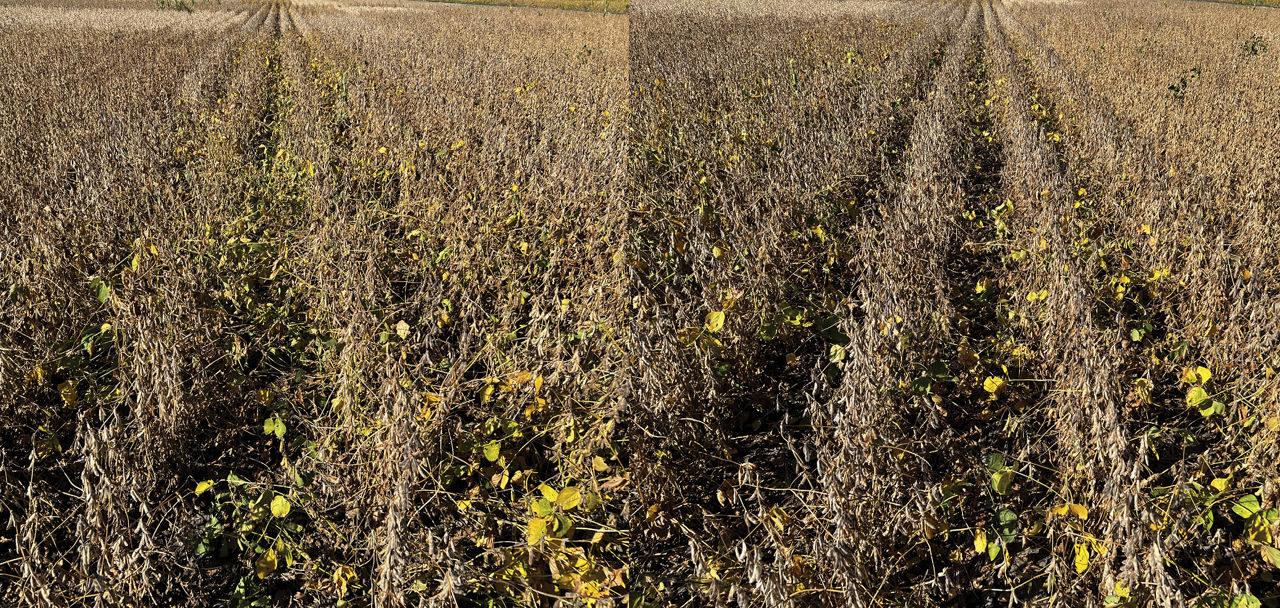
- The 2023 weather conditions provided the plants with adequate moisture after planting and through most of the growing season, until the weather turned very hot and dry in late August through September.
- Heat and moisture stress during the late reproductive stages severely reduced yield potential from the originally predicted 70 to 80 bushels per acre.
- There were no statistically significant differences in average yield between maturity groups (MG) (data not shown).
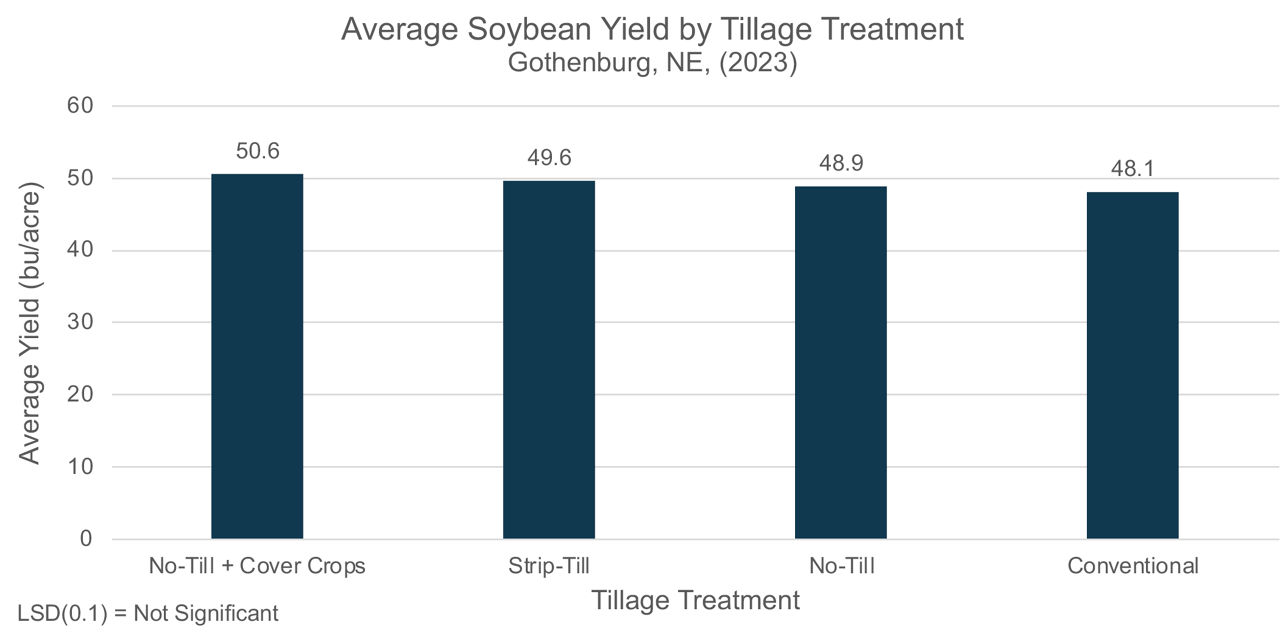
- There were no significant differences in average yields between tillage treatments, despite the dry conditions at the end of the season (Figure 2).
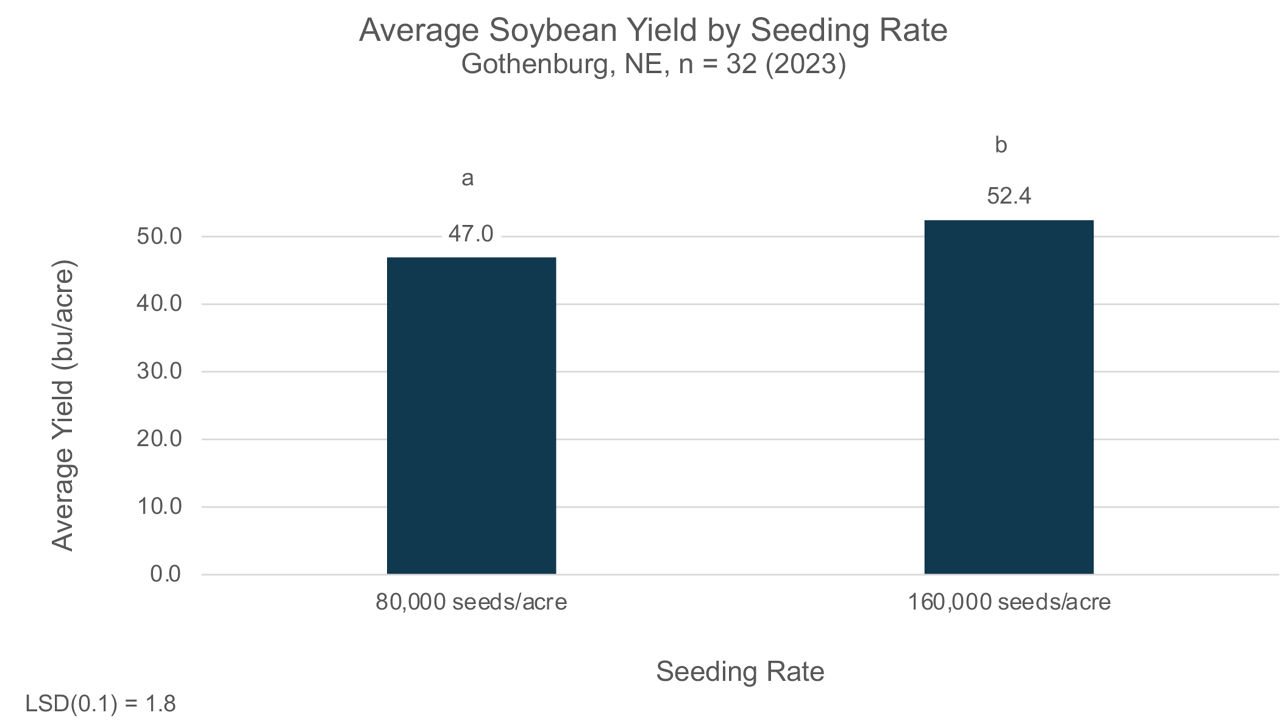
- The 80,000 seed/acre seeding rate resulted in an average yield of 47 bu/acre, and the 160,000 seed/acre seeding rate resulted in an average yield of 52.4 bu/acre (Figure 3).
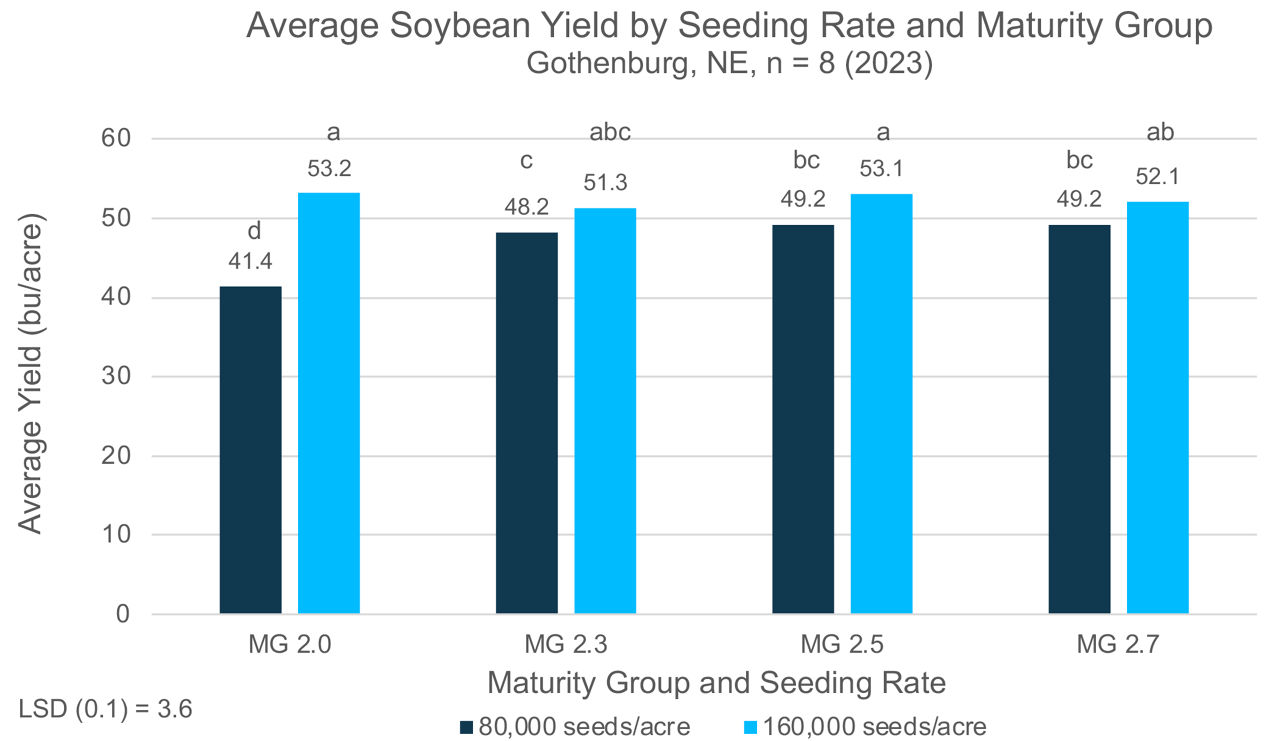
- A higher seeding rate provided a significant yield increase in the 2.0 and 2.5 relative maturity groups. At the lower seeding rate, the maturity group 2.0 product had the lowest yields in the trial (Figure 4).
KEY LEARNINGS
- Tillage systems did not impact yield as it had in previous trials. Adequate soil moisture early in the season prior to canopy closure may have mitigated solar evaporation from the tilled soils.
- When averaged across the other management practices tested, soybean maturity group alone did not produce a significant difference in average yield (data not shown).
- However, soybean seeding rate did have an impact on yield on the MG 2.0 and MG 2.5 treatments in dry conditions. A seeding rate of 160,000 seeds/acre increased the average yield in each maturity group by about 7.9 bu/acre compared to a seeding rate of 80,000 seeds/acre.
- We will continue to evaluate this trial in future years to determine which, if any, of these factors consistently influence yields over time.
1310_391000
Disclaimer
Always read and follow pesticide label directions, insect resistance management requirements (where applicable), and grain marketing and all other stewardship practices.