3 MIN READ
Effect of Soybean Seeding Rate and Row Spacing on Yield and Profitability
December 8, 2021
Get Year-Round Updates From Our Agronomic Experts
TO COMPARE YEARLY RESEARCH DATA, CLICK ON A TAB.
TRIAL OBJECTIVE
Improvements in soybean genetics, planting technology, and weed control systems have led to lower planting rate recommendations for soybean growers1 over the past decade.
Although yields generally increase with increasing planting rates, commodity prices affect which planting rate will be most economical.
This research was conducted with a goal of understanding the impact of plant population and row spacing on yield and grower profitability.
RESEARCH SITE DETAILS
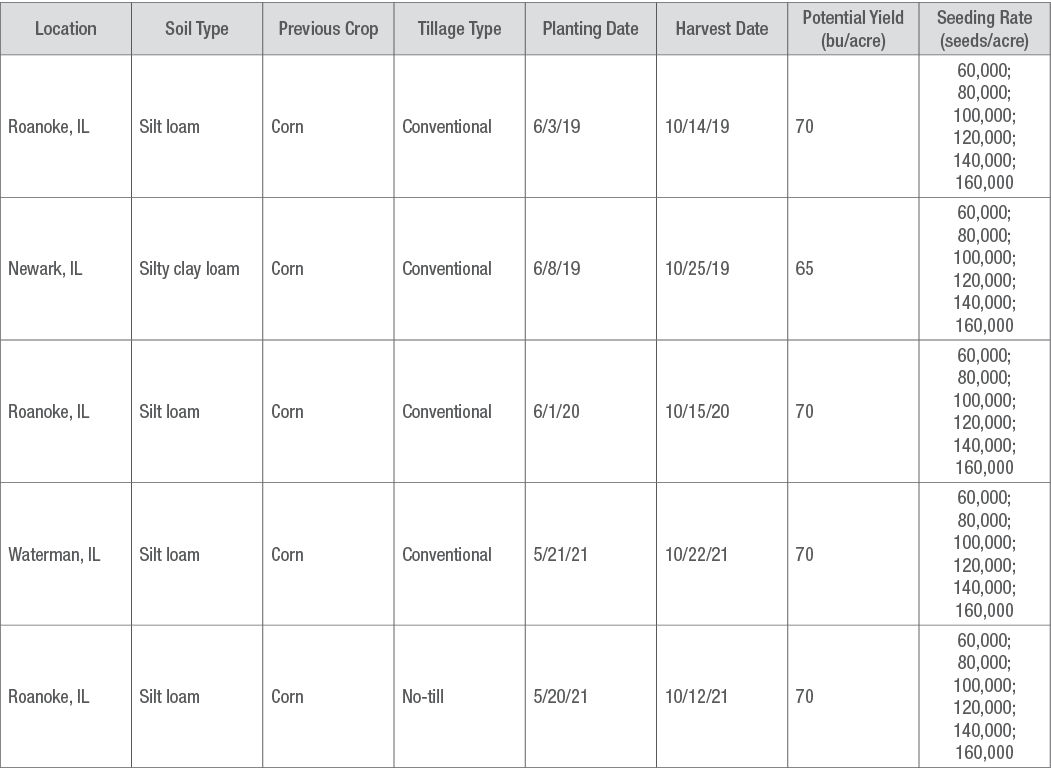
This research was conducted at Bayer Crop Science FOCUS sites in Illinois counties, Kendall, Dekalb, and Woodford from 2019-2021.
Sixteen 2.2-2.9 maturity group (MG)soybean products were planted, with different soybean products used in different years.
Seeding rates ranged from 60,000 to 160,000 planted seeds per acre.
Four replications of this trial were planted at each location and year.
The 2019 growing season was very cool and wet through early June, leading to delayed planting for many growers. Hot and dry conditions were prevalent in July and August, and excessive rainfall returned in September and October.
In both 2020 and 2021, there was sufficient moisture in the early part of the growing season, but very dry conditions throughout August and into September.
UNDERSTANDING THE RESULTS
On average, over the 3 years in this research, the highest yielding configuration was 160,000 seeds/acre, planted in 20-inch rows (Figure 1).
Based on soybean grain value of $12/bushel, the most profitable planting configuration is also 160,000 planted seeds/acre in 20-inch rows (Figure 1).
When a soybean commodity value of $8/ bushel is used for calculations (Figure 2), a planting rate of 160,000 seeds/acre is still the most profitable. However, the profitability curve is relatively flat at planting rates from 120,000 to 160,000
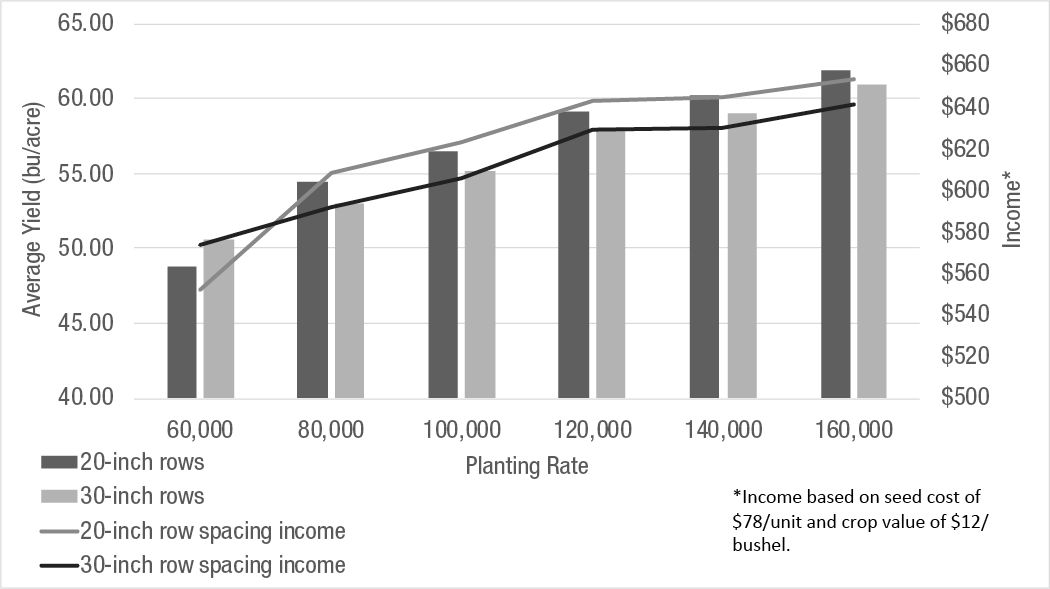
Figure 1. Average soybean performance and profitability under different row widths and seeding rates in Illinois, 2019-2021.
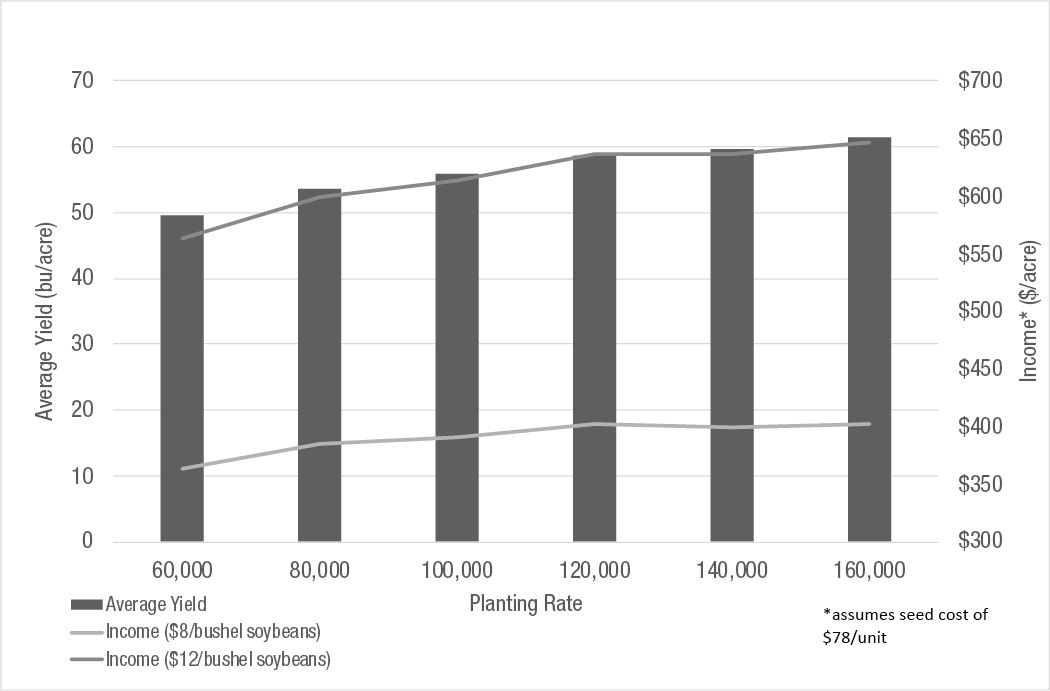
Figure 2. Effect of commodity price on average profitability of different planting rates in Illinois, 2019-2020.
KEY LEARNINGS
Although the average planting date in this research was later than growers would typically wish to plant, the results are representative of what we see in earlier plantings; there is typically less yield effect related to a correlation between planting dates and planting rates than generally accepted2.
Although a planting rate of 120,000 seeds/acre will sometimes be sufficient to maximize profitability, growers wishing to increase yield or anticipating higher commodity prices may increase planting rates up to 160,000 without incurring much additional risk from an income perspective.
Sources:
1Licht, M. Soybean plant population. Iowa State University. https://crops.extension.iastate.edu/encyclopedia/soybean-plant-population
2Pedersen, P. Optimum plant population in Iowa. Iowa State University. https://crops.extension.iastate.edu/files/article/OptimumPlantPop_000.pdf
3011_R13
Disclaimer
ALWAYS READ AND FOLLOW GRAIN MARKETING AND ALL OTHER STEWARDSHIP PRACTICES AND PESTICIDE LABEL DIRECTIONS.