Crop ScienceUnited States
Long-Term Impact of Fertilizer Withdrawal on Corn Yield Potential and Soil Properties
June 26, 2024
TRIAL OBJECTIVE
- The relationship between fertilizer application and crop yield is well-documented with fertilizers playing a crucial role in enhancing soil fertility and promoting plant growth.
- Nitrogen (N) is probably one of the most limiting nutrients for high yielding corn. Given the crop’s substantial demand for this nutrient, farmers add fertilizer to supplement natural N levels in the soil.
- Evaluating the long-term impact of fertilizer withdrawal on corn grain yield potential and soil properties is the objective of this study.
RESEARCH SITE DETAILS

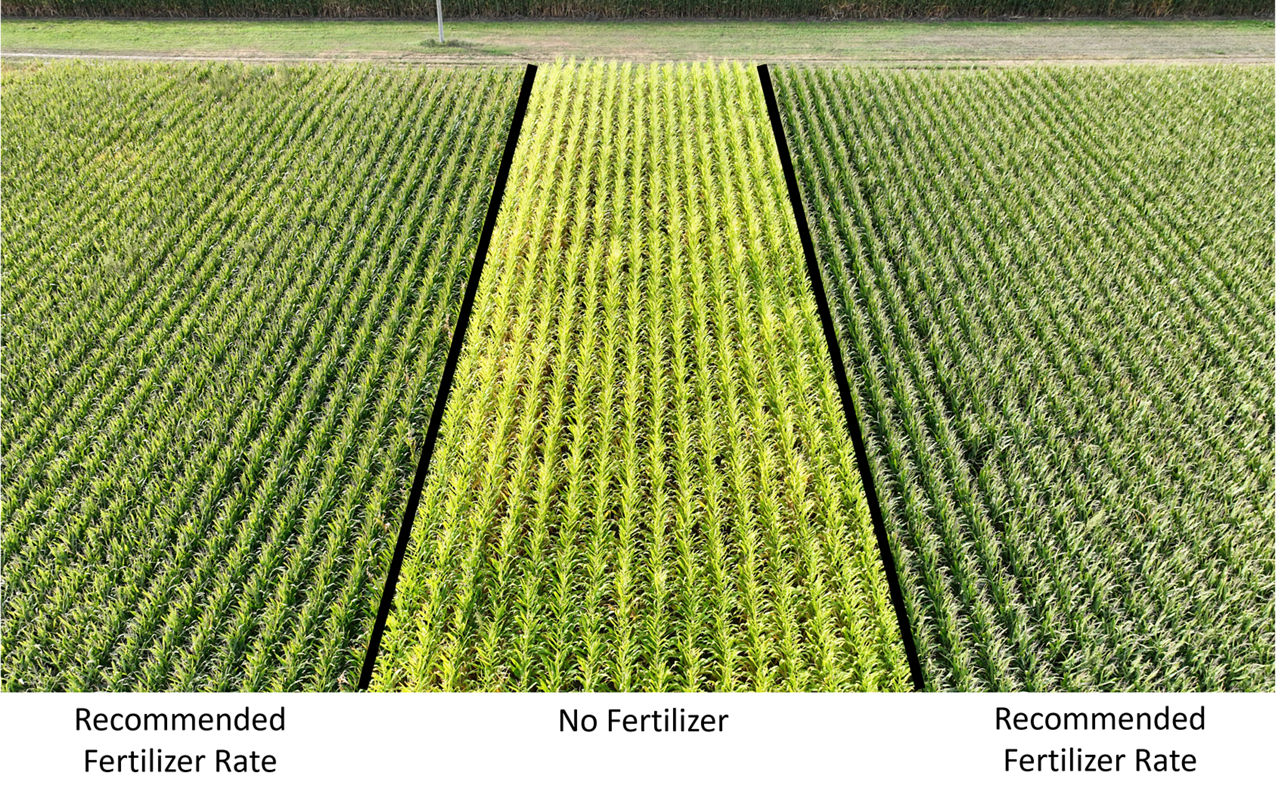
- The study consisted of a 40 ft wide by 150 ft long strip that has been in continuous corn for 14 years. Soybean was the previous crop and last planted in 2009. No fertilizer has been applied since 2010. However, an estimated average of 11 lb/acre of N per year was added through irrigation based on water nitrate levels. This average increased or decreased depending on irrigation application each season.
- Cover crops were not utilized in the area to limit sources of N and organic matter (O.M.) entering the system.
- Corn was fully irrigated throughout the growing seasons.
- Zero to 8-inch and 8 to 24-inch composite soil samples were taken in the spring.
- The trial was strip-tilled every year a few weeks before planting, with no application of nutrients.
- Weeds were controlled uniformly across the study area.
- Plots were combine-harvested with grain moisture content, test weight, and total weight collected.
UNDERSTANDING THE RESULTS
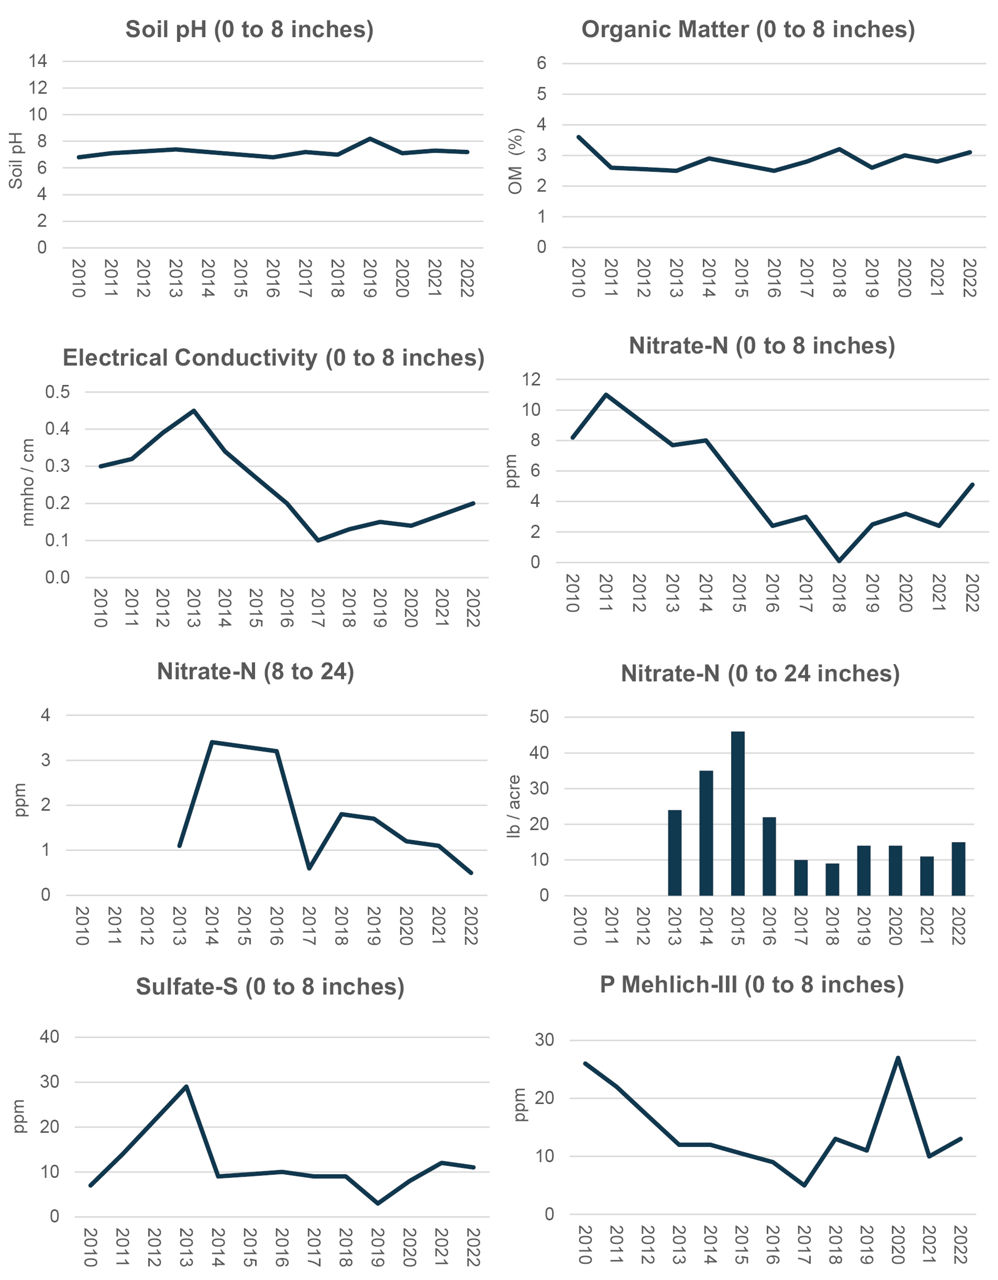
- As expected, soil N levels were the most negatively impacted after withdrawing fertilization (Figure 2). However, this decline was not immediately observed.
- Nitrate levels at the 0 to 8-inch and 8 to 24-inch depths began to descend approximately 4 to 5 years after starting the study.
- The decline in N levels is clear if focused on the amount of Nitrate-N per acre in the 0 to 24-inch profile. From 2013 to 2016, the average was 32 lb/acre of Nitrate-N, while from 2017 to 2022 it was around 12 lb/acre.
- No clear trend was observed in test results for soil pH, O.M., and Sulfate-S throughout the years.·
- Except for the 2020 soil test results, phosphorus (P) concentration at the 0 to 8-inch depth tended to decrease over time. After 12 years of continuous corn without fertilization, P levels were 50% lower compared to the beginning (13 vs 26 ppm).
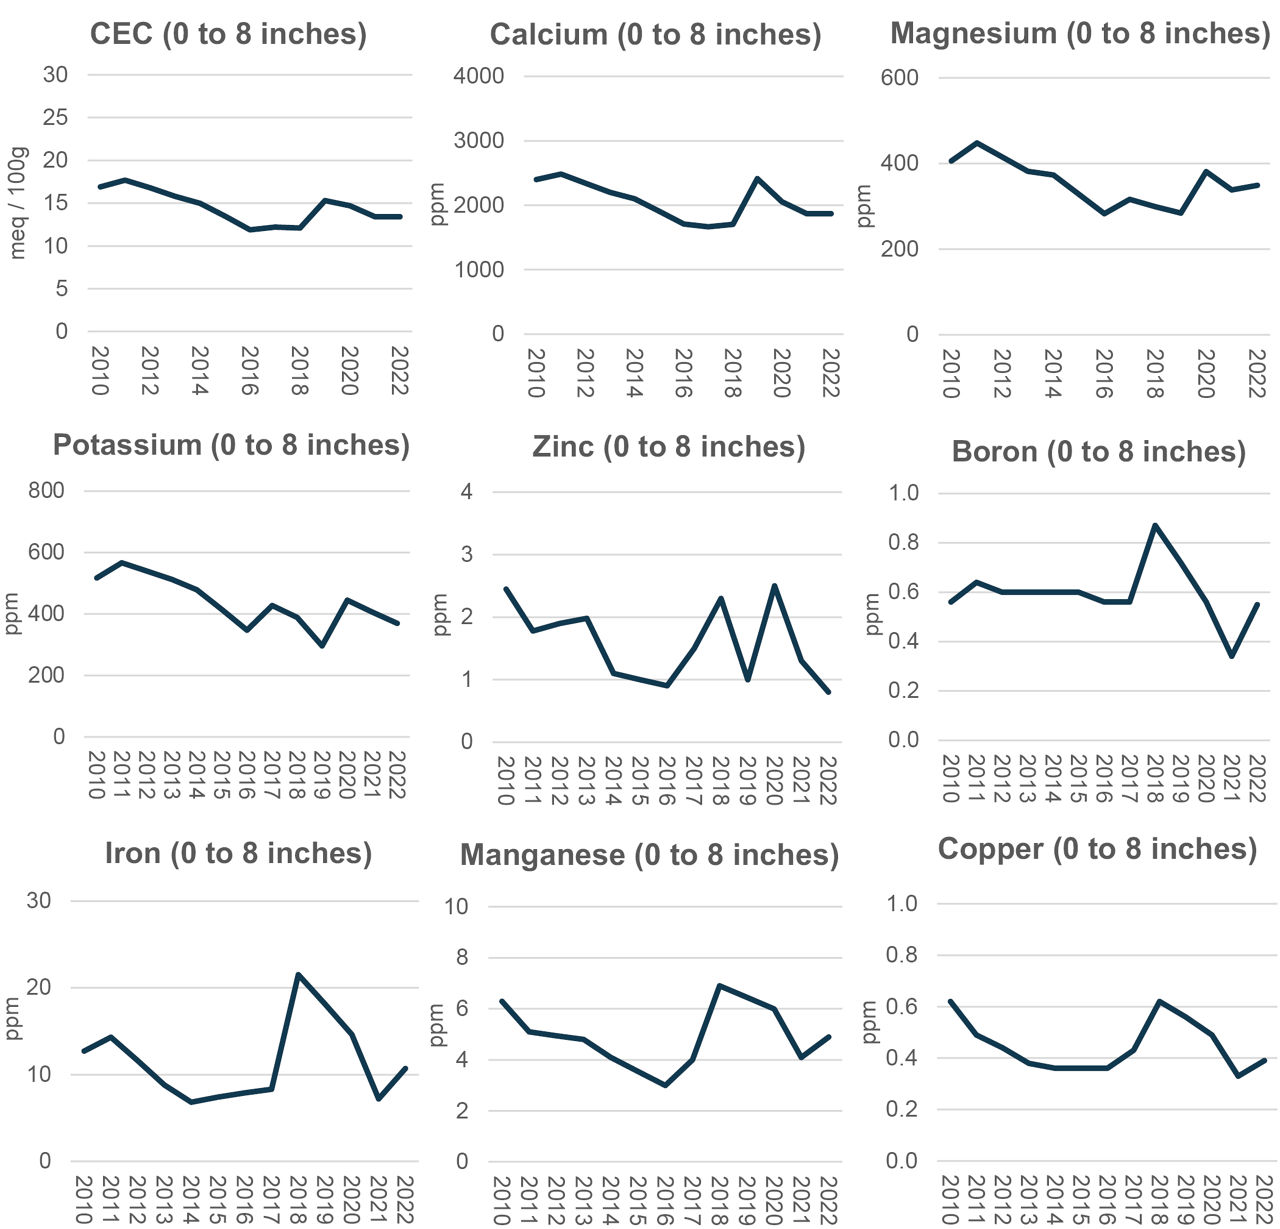
- Cation exchange capacity (CEC) decreased around 20% from 2010 to 2022 (Figure 3). This is a result of a decline in calcium (Ca), magnesium (Mg), and potassium (K) concentrations in the 0 to 8-inch soil depth. Corn production removes nutrients from the soil, and the exact removal rate can vary depending on factors such as soil fertility, yield, and weather conditions.
- Soil test results for micronutrients like zinc (Zn), boron (B), iron (Fe), manganese (Mn), and copper (Cu) fluctuated over time, but no consistent downward trend was observed.
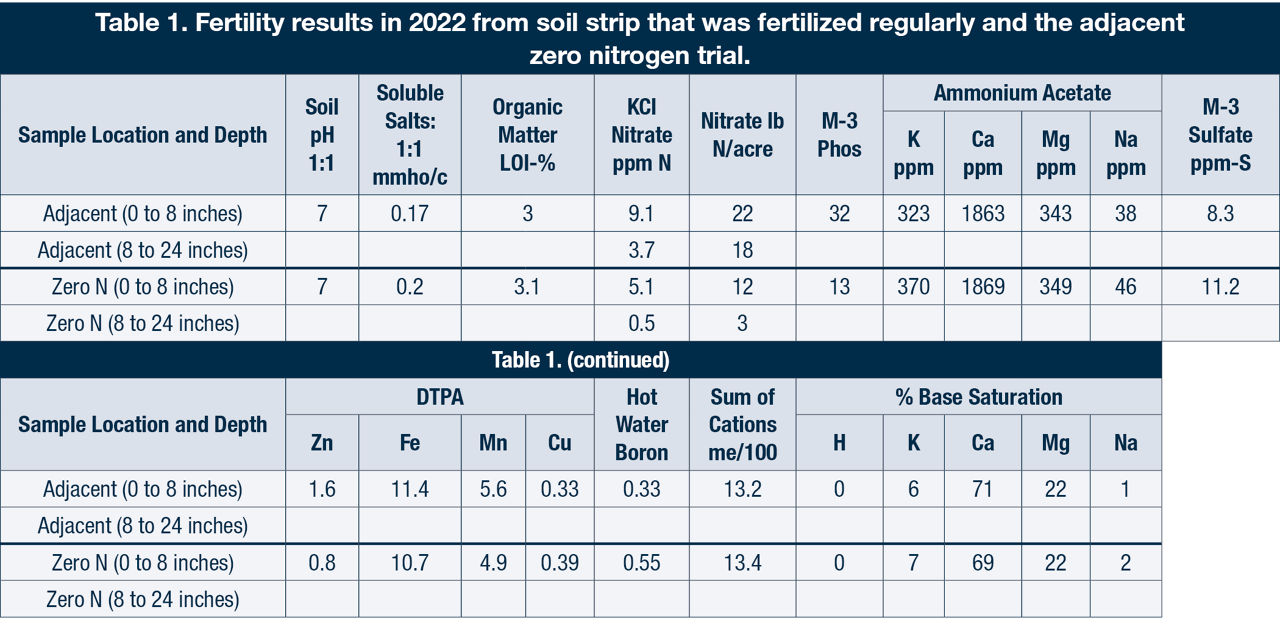
- In 2022, soil that was fertilized regularly for crop production was sampled adjacent to the zero N trial to evaluate change between the two management systems (Table 1). The soil adjacent was typically managed in a corn and soybean rotation and fertilized with N, P, S, and Zn as required for production.
- Higher nitrate levels, higher P levels, and higher Zn levels were noted, along with lower levels of Zn in the adjacent sample otherwise the soil chemical properties did not seem affected. Even organic matter was consistent between the systems (Table 1).
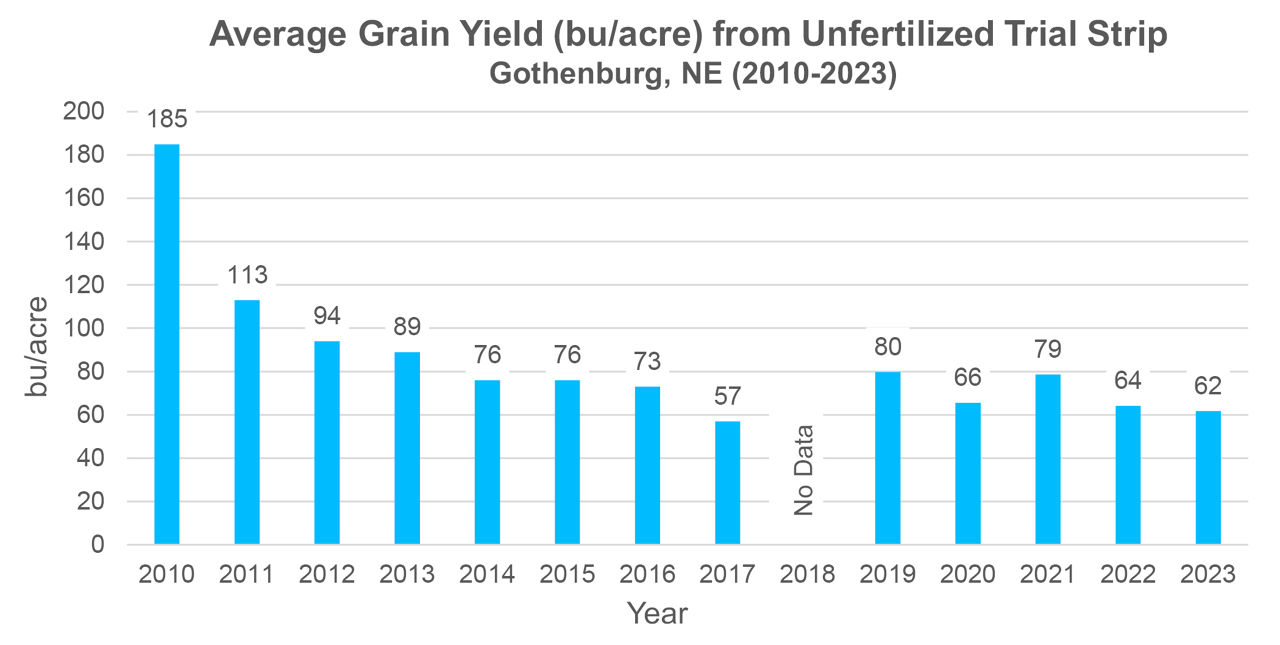
Corn grain yield (Figure 4)
- In 2010, after a soybean crop in 2009, corn grain yield without fertilization was 185 bu/acre. At this point, soil N levels could still sustain a decent crop and some breakdown of soybean residue provided some N to the corn throughout the season. Previous management could have resulted in higher levels of residual N.
- In 2011, a large decline in grain yield (113 bu/acre) was observed. This downward trend continued until 2014, but at a lower rate. After that, yield tended to stabilize around 70 bu/acre.
- The last two years of this series (2022 and 2023) registered 64 and 62 bu/acre, respectively.
- Yield data for 2018 missing because trial was accidentally harvested as bulk. Grain was collected without weight recorded and stover was not removed.
KEY LEARNINGS
- These findings highlight the importance of fertilization in crop production. After 5 years of continuous corn without supplemental fertilizer, grain yield dropped at least by a factor of 5 times compared to plots that were rotated and appropriately fertilized.
- Although several nutrients were below recommended critical levels, N has been the most limiting based on crop deficiency symptoms.
- The main reason for maintaining this site is to understand soil nutrient dynamics with no additional fertilization, continuous strip-till, and growing continuous corn. This trial provides an excellent way to evaluate the impact of N deficiency on corn yield potential. It is also valuable for discussing why farmers use fertilizer to groups that are not familiar with corn production.
- Based on learnings from long-term trials such as the Morrow Plots at the University of Illinois, expectations were for declines in O.M. over time.1 Yearly strip-tillage, reliance on mineralization for nutrients, and low residue production because of reduced yield are factors that would typically be assumed to cause O.M. reductions. Based on current data, that has not happened in this trial.
- Understanding nutrient removal is crucial for maintaining soil fertility and helping to maximize yield potential.
Source
1Odell, R.T., Walker, W.M., Boone, L.V., and Oldham, M.G. 1982. (revised 1984). The Morrow Plots. A century of learning. Bulletin 775. Agricultural Experiment Station. College of Agriculture. University of Illinois at Urbana-Champaign. https://archive.org/details/morrowplotscentu00univ/page/n7/mode/2up
1217_404550
Disclaimer
ALWAYS READ AND FOLLOW GRAIN MARKETING AND ALL OTHER STEWARDSHIP PRACTICES AND PESTICIDE LABEL DIRECTIONS.