Long-Term Limited Irrigated Crop Rotation at Gothenburg, NE
August 11, 2021
Get Year-Round Updates From Our Agronomic Experts
Trial Objective
Crop rotation is an effective way to help reduce pests (insect, disease, and weed) pressure, increase crop residue, and build organic matter in the soil. Crop residue and organic matter can help improve water-holding capacity and nutrient availability for the next crop.
The objective of this study was to determine the effect of crop rotation on yield potential in a limited irrigation environment where no more than 4 inches of irrigation water was applied to the crop each year.
Research Site Details
- This trial was located at Gothenburg, NE on a silt loam soil type and includes data from 2015 through 2020.
- Randomized complete block design with three replications.
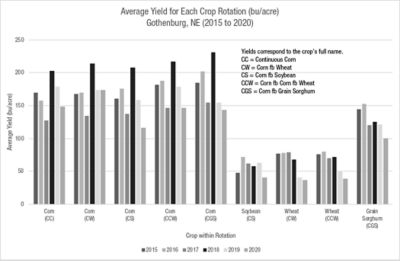
- The rotational crops used were corn, winter wheat, soybean, and grain sorghum.
- Rotation treatments (Table 1):
- Continuous Corn (CC)
- Wheat followed by (fb) Corn (WC)
- Corn fb Soybean (CS)
- Wheat fb Corn fb Corn (WCC)
- Corn fb Grain Sorghum (CGS)
- All crops in a rotation were present in each year of the study.
- Irrigation was applied with a subsurface drip irrigation system with no more than 4 inches of irrigation water applied to the crop each year from 2015 to 2018. No irrigation was applied to any rotation in 2019 because of adequate rainfall and in 2020 due to mechanical issues within the drip irrigation system.
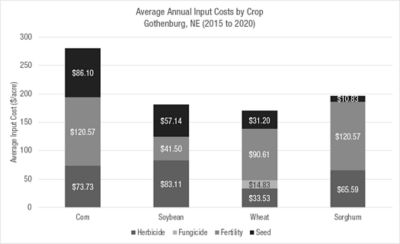
- Adequate fertility was applied each year and pesticides were applied as needed per crop. The average input costs for fertility and pesticide applications are provided in Figure 5.
Table 1. Description of treatments and crop rotation.
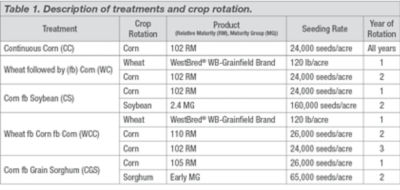
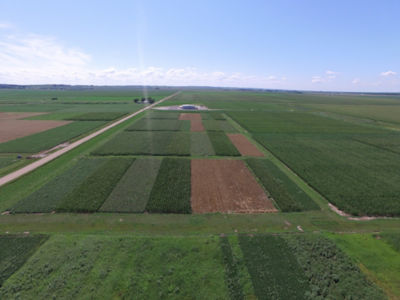
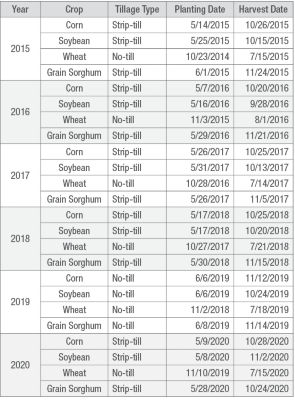
Table 2. Tillage type, planting date, and harvest date information for each crop by year.
Understanding the Results
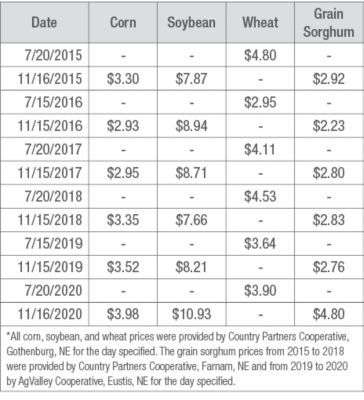
Table 3. Grain price per bushel for a specific day of sale from 2015 to 2020.
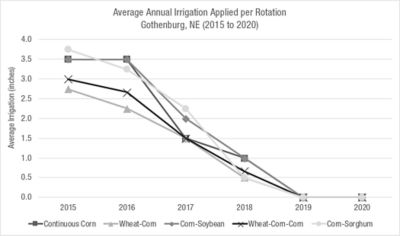
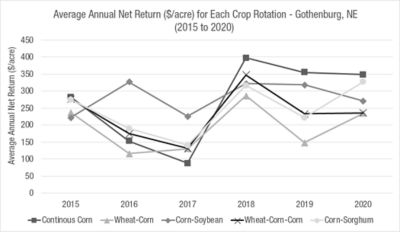
- There did not appear to be a correlation between annual irrigation applied and gross and net returns for any crop rotation (Figures 3, 4, and 6).
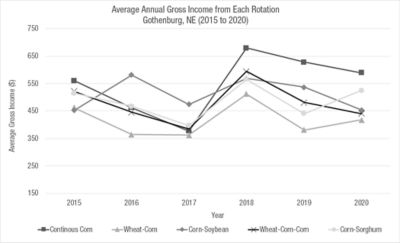
- From 2015 to 2017, all crop rotations generated comparable gross income except for the Corn-Soybean rotation which produced a greater gross income. The continuous corn rotation produced the greatest gross income from 2018 to 2020, and the Wheat-Corn rotation consistently produced the lowest gross income (Figure 4).
- Corn required the largest input costs per acre followed by sorghum, soybean, and wheat, respectively. Fertility was the largest input cost for corn, sorghum, and wheat, while herbicides were the largest for soybean (Figure 5).
- In 2015, all crop rotations produced comparable net returns. The Corn-Soybean rotation produced the greatest net return from 2016 to 2017, followed by the Continuous Corn rotation from 2018 to 2020 (Figure 6).
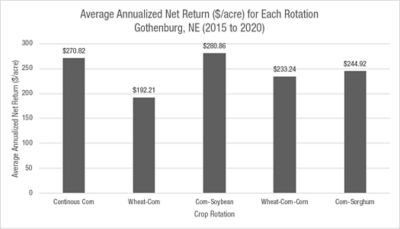
- Over the six-year study, on average, the Corn-Soybean rotation produced the greatest net return per acre followed by the Continuous Corn rotation (Figure 7).
Key Learnings
- The gross and net returns for each crop rotation were comparable in 2015, which may be a result of it being the first year of each crop rotation.
- The lower gross income and net return values from 2016 to 2017 were due to low corn grain prices in those years.
- The largest net return was for the Corn-Soybean rotation. This rotation can benefit farmers by helping to reduce disease and insect pressure. Lower pest pressure should decrease pesticide input cost over the next six years of the study.
- Continuous Corn provides a large net return but is likely to have increased pest pressure and increased pesticide input costs depending on the environment and pest pressure.
1030_R1
Disclaimer
ALWAYS READ AND FOLLOW GRAIN MARKETING AND ALL OTHER STEWARDSHIP PRACTICES AND PESTICIDE LABEL DIRECTIONS.