Plot Results Evaluation
October 7, 2024
- Understanding the genetic characteristics of each corn product is important for evaluating performance, especially after stressful growing conditions such as drought.
- After a stressful growing season, securing as much local and regional product information as possible can help with future product selection.
- To gather this information, growers can talk with reliable local sources, look up brand performance information online, contact local seed representatives, and review yield trials from universities and independent organizations.
- Understanding statistical significance and LSDs is important when evaluating this information.
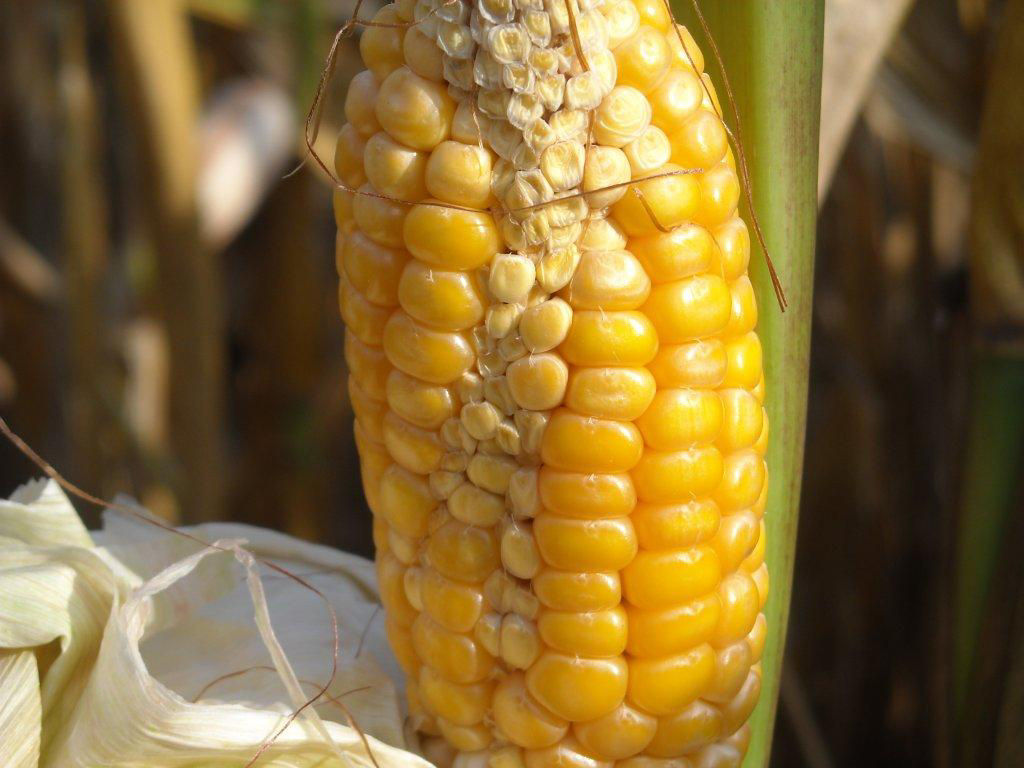
Understanding the genetic characteristics of each corn product is important for evaluating performance, especially after stressful growing conditions such as a drought (Figure 1). Stressful growing conditions could alter corn product performance and may affect growers’ opinions when yields are less than desired. However, it is important to fully evaluate how a corn product performed before reaching any conclusions.

Most corn products can be placed into two categories—offensive or “racehorse” products and defensive or “workhorse” products. Offensive-type products are those that usually have exceptional yield potential when growing conditions are favorable and when the product is planted in fields with high yield potential. High yield-potential fields have characteristics that may include high-production soil types, optimum nutrient availability based on soil pH and CEC, high organic matter, good drainage, and other factors favorable for maximizing yield potential. Defensive-type products are those that may not have the yield potential of offensive products if planted in high yield-potential fields, but which may be better adapted to growing in lighter soils and/or lower yield-potential fields. Under drought stress, defensive products may shine because of their genetic characteristics and perform better than offensive products.
Historical information for a farm can be useful for product evaluation. However, if this was the first year a product was planted and performance was better or worse than expected, growers can help reduce the bias caused from observing a single location and make more objective decisions by securing as much local and regional product information as they can to help with future product selection. The same product planted by other growers may have performed better based on factors such as planting date, tillage type, seeding rate, fertilizer or fungicide applications, and field location. To gather more information on product performance, growers can talk with reliable local sources, look up brand performance information online, contact local seed representatives, and review yield trials from universities and independent organizations. When searching for information, it is important to evaluate multiple locations and review the growing parameters for each location. The product may have performed better or worse at one location because of those parameters.
Analyzing Plot Data
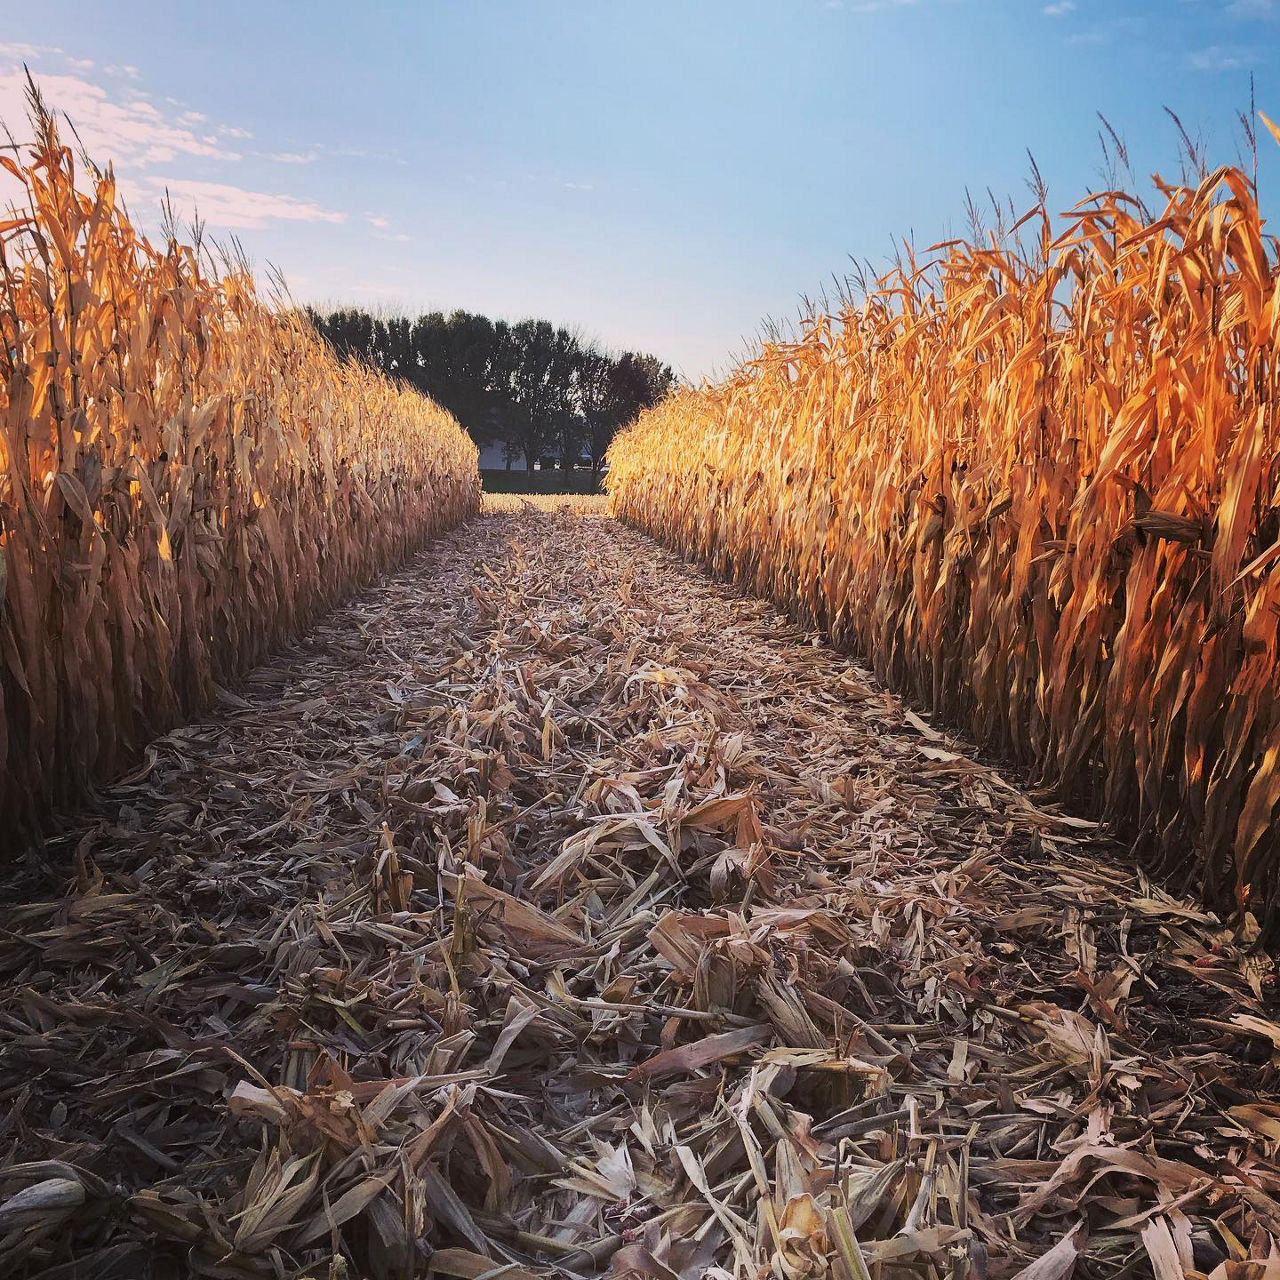
Comparing data on multiple products between multiple plots to make the best product selection decisions can be difficult, as many factors could be responsible for any observed differences between product yields—such as plot location or soil type (Figure 2). When comparing only two plots, it is often impossible to determine if any yield differences are caused by the corn product or by another factor. To account for this, multiple plots should be evaluated when comparing different products head-to-head.

Statistical Differences
Sometimes—in any situation, not just when interpreting yield results—differences occur simply as a result of random chance. For example, if two coins are flipped five times each and the first coin lands on four heads and one tail, while the second coin lands on two heads and three tails, one intuitively knows that this doesn’t mean the first coin is more likely to land on heads than the second coin. Statistical analysis is used to determine the likelihood of an outcome being the result of random chance. When interpreting yield results, statistically significant differences indicate that the results are less likely to have occurred by chance than because of a real difference, and significant results are more likely to be repeatable. If yield differences are not statistically significant, any observed differences are likely no greater than what could be caused by random variations within the field. Increasing the number of replications in a plot improves a statistical test’s power to detect real differences in the data. (If the same two coins were flipped again, 10 times each this time, and the first coin landed on nine heads and one tail, it suddenly seems more likely that something significant is going on with that coin.)
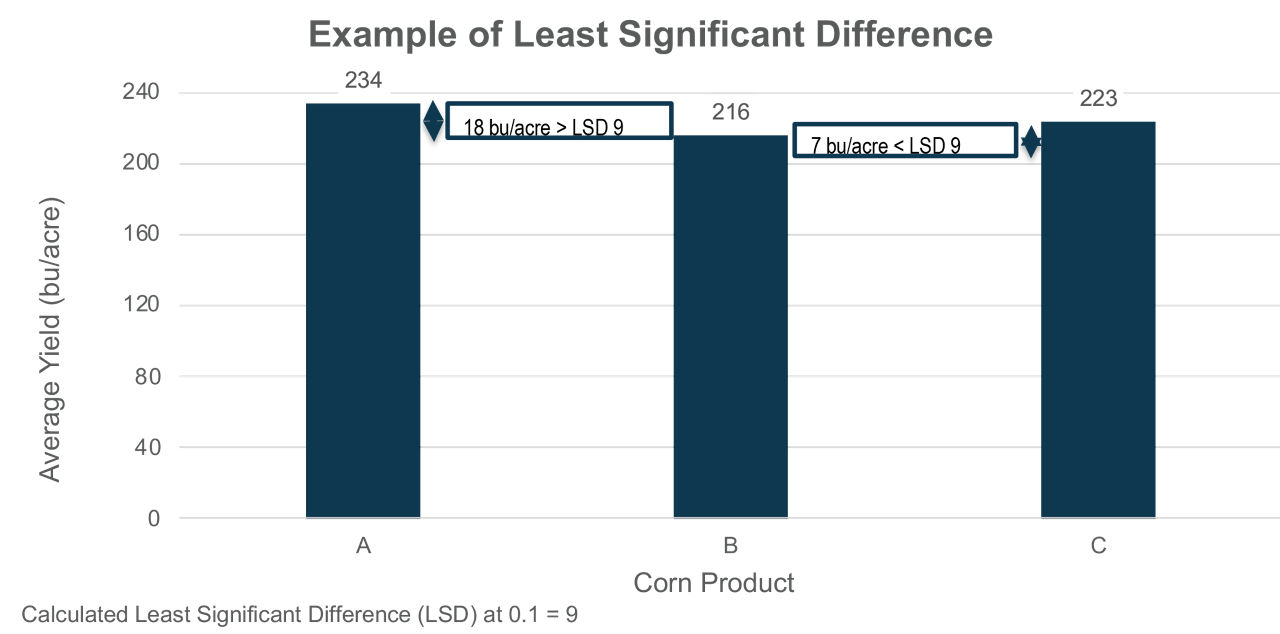
Yield analyses, like those from university and independent plot results, may include a least significant difference (LSD) value. LSD values usually appear at the bottom of tables or graphs (Figure 3, bottom left) and may be written in a few different formats. For example, the LSD in Figure 3 could be written as LSD(0.1) = 9; LSD0.1 = 9; LSD of 0.1 = 9; or LSD = 9, p = 0.1. However it is written, an LSD contains two pieces of information: the significance level and the LSD value.
The significance level (usually 0.1 or 0.05; 0.1 in the Figure 3 example) indicates the odds that differences might still be the result of random chance, even if they are statistically significant. A significance level of 0.1 means that significant differences have a 10% chance of still being the result of random variations. A significance level of 0.05 means that significant differences have a 5% chance of still being the result of random variations. (The significance level will always be a decimal. A significance level of 0.99 would indicate a 99% chance, and 0.01 would indicate a 1% chance. The smaller the significance level, the less likely any statistically significant differences are the result of random chance.)
When measuring yield differences between products, the LSD value indicates the amount of yield variation that can be attributed to the product itself (the thing that was deliberately changed between plots) versus the amount of variation that likely came from the influence of other factors (drainage, previous crop, compaction, fertility, failed weed control, insect pressure, etc.). In yield analyses, yield differences greater than the LSD can likely be attributed to actual differences in the genetic yield potential of the products (though keep the significance level in mind). Yield differences less than the LSD are not considered statistically significant and are not likely to be repeatable.
The example yield analysis in Figure 3 represents a subset of data from a field trial with a calculated LSD of 9 at a significance level of 0.1. The difference in yield between products A and B is 18 bu/acre, which is greater than the LSD of 9; therefore, we are 90% certain (100% − 10% significance level = 90% certain) the yield is indeed significantly different due to real differences in the corn products and not likely due to random variation. The difference in yield between products B and C is 7 bu/acre, less than the LSD of 9; therefore, we cannot conclude that the yield levels are significantly different, and the observed difference is likely not due to the products but instead to random variation. Essentially, product A is different than products B and C, which are the same.

1210_456700