Channel® Brand Corn Yield Response to Planting Rates and Water Availability Across Environments – High Plains
May 5, 2026
Get Year-Round Updates From Our Agronomic Experts
TRIAL OBJECTIVE
- Available water—either in the form or rainfall or irrigation—is a key factor for corn production in the states of Kansas, Colorado, and Nebraska.
- Average rainfall can vary greatly year over year across these states. For irrigated acres in the region, the total amount of irrigation water applied can vary greatly due to physical limits on total irrigation capacity and/or regulations that limit the total amount of irrigation water that can be applied over a certain period.
- To maximize the economic productivity of their acres, growers in the area must try to find a balance between planting density, available water, and expected rainfall for the season.
- Corn products can have varying ear flex potential which may influence yield (bushels/acre and yield per thousand plants – YPT).
RESEARCH SITE DETAILS
- Trials were planted across the states of Kansas, Colorado, and Nebraska.
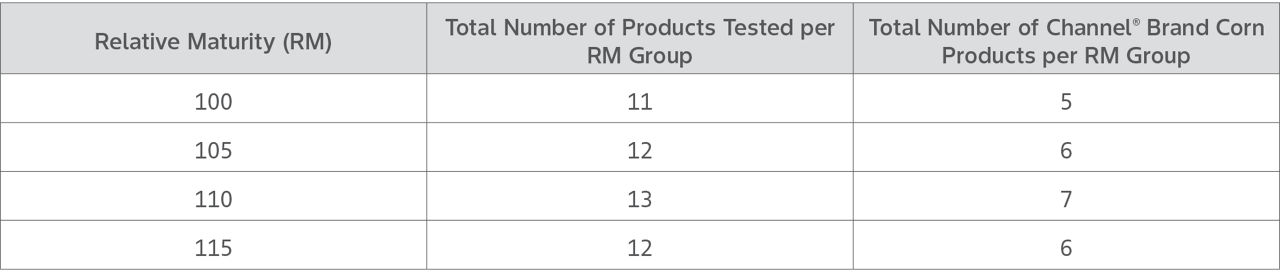
- Twenty-four Channel® brand corn products, out of a total of 48 products, in four relative maturity (RM) groups were included in this trial (Table 1).
Table 1. Total number of corn products in each relative maturity (RM) group and the number of Channel® brand products included in each in this trial.
- Each corn product was planted at the following densities (seeds per acre):
- 12,000
- 16,000
- 20,000
- 24,000
- 28,000
- Each corn product by planting density combination was replicated three times at each location.
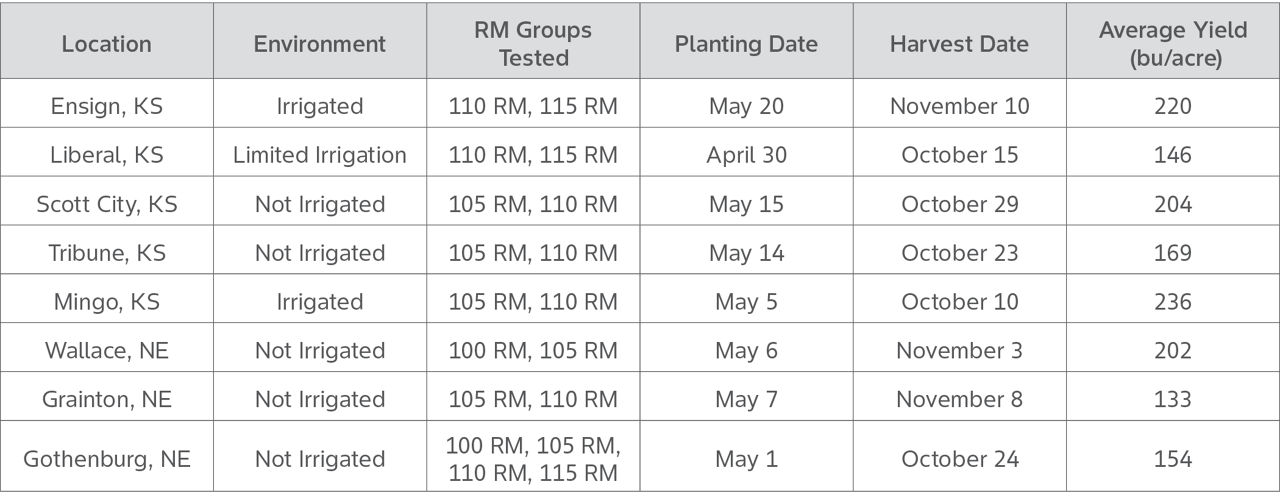
Table 2. Trial locations, growing environment, relative maturity (RM) groups, planting dates, harvest dates, and the average yield for each location in this trial in 2025.
Normalized Performance: Yield data were normalized in order to compare the performance of each product across varying yield environments. Data are normalized by determining the average plot yield for each relative maturity group (set RM group average yield) at each planting density and the standard deviation for the same group (set RM group STDV). The formula is as follows.
Individual Plot Yield - Set RM Group Average Yield
Set RM Group STDV
The normalized yield data were then averaged across all products x seeding rate x location. This formula compares the relative performance of a product with other products of similar maturity when planted at the same seeding rate. This type of comparison indicates the potential yield performance of a product across varying yield environments.
If the normalized yield data is greater than zero, the product response to seeding density is above average compared to its peer group. A number below zero indicates below average performance compared to its peer group.
UNDERSTANDING THE RESULTS
Table 3. The relative maturity (RM) group, trait technologies, corn yield expressed as yield per thousand plants (YPT), and the calculated normalized performance of each corn product at each seeding rate in this trial in 2025.
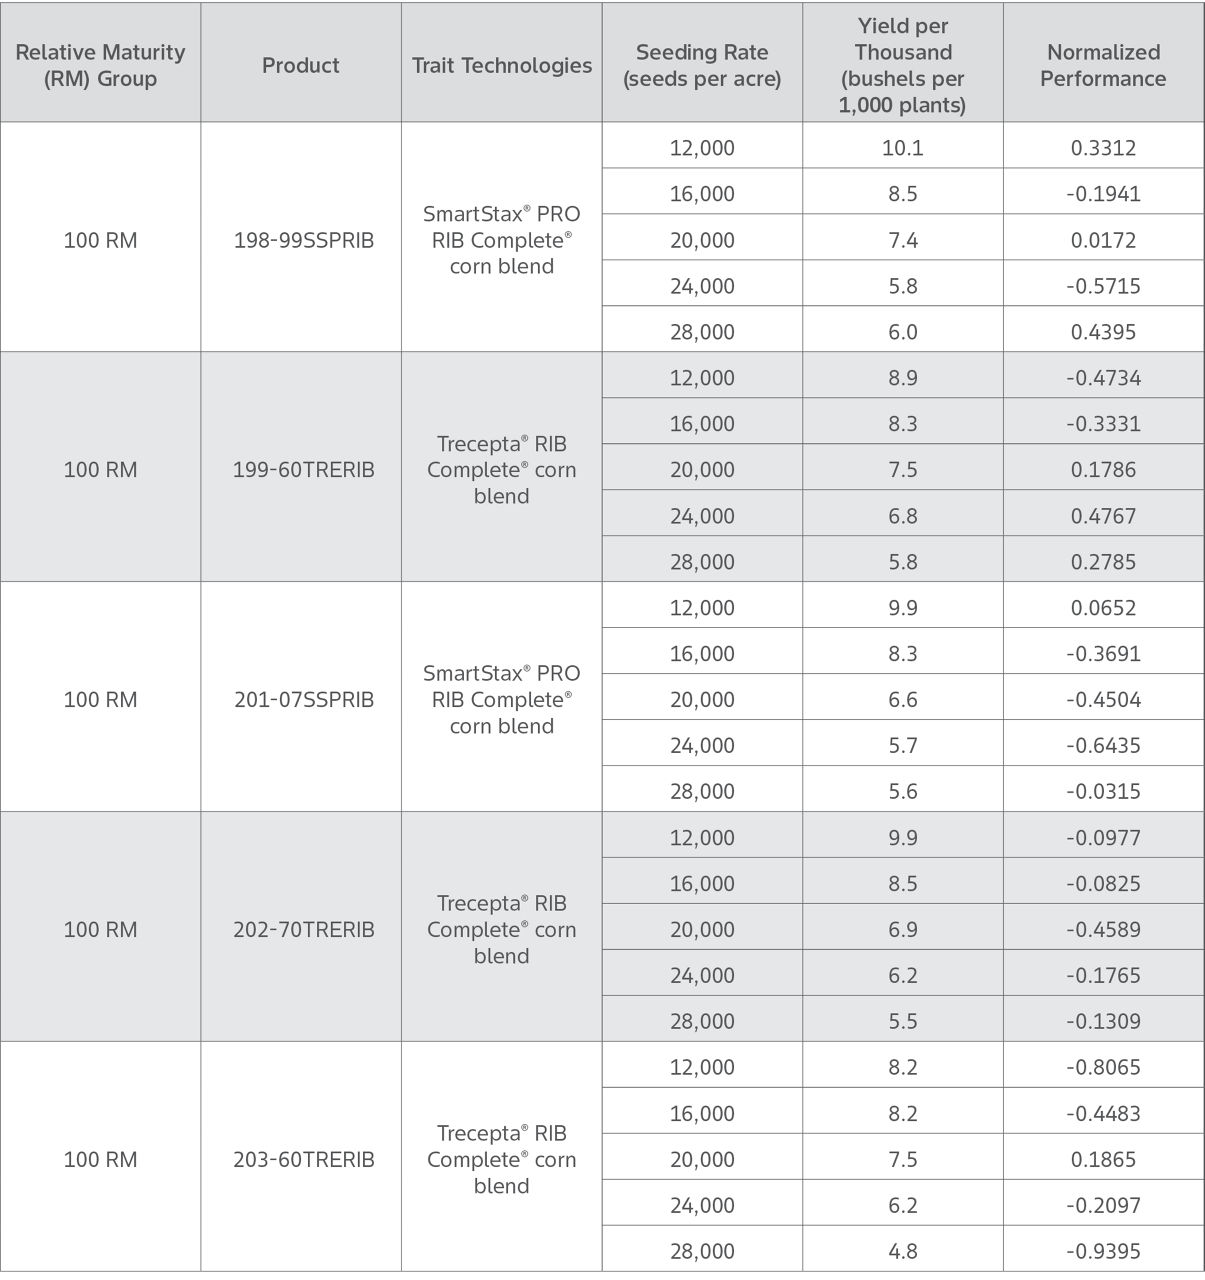
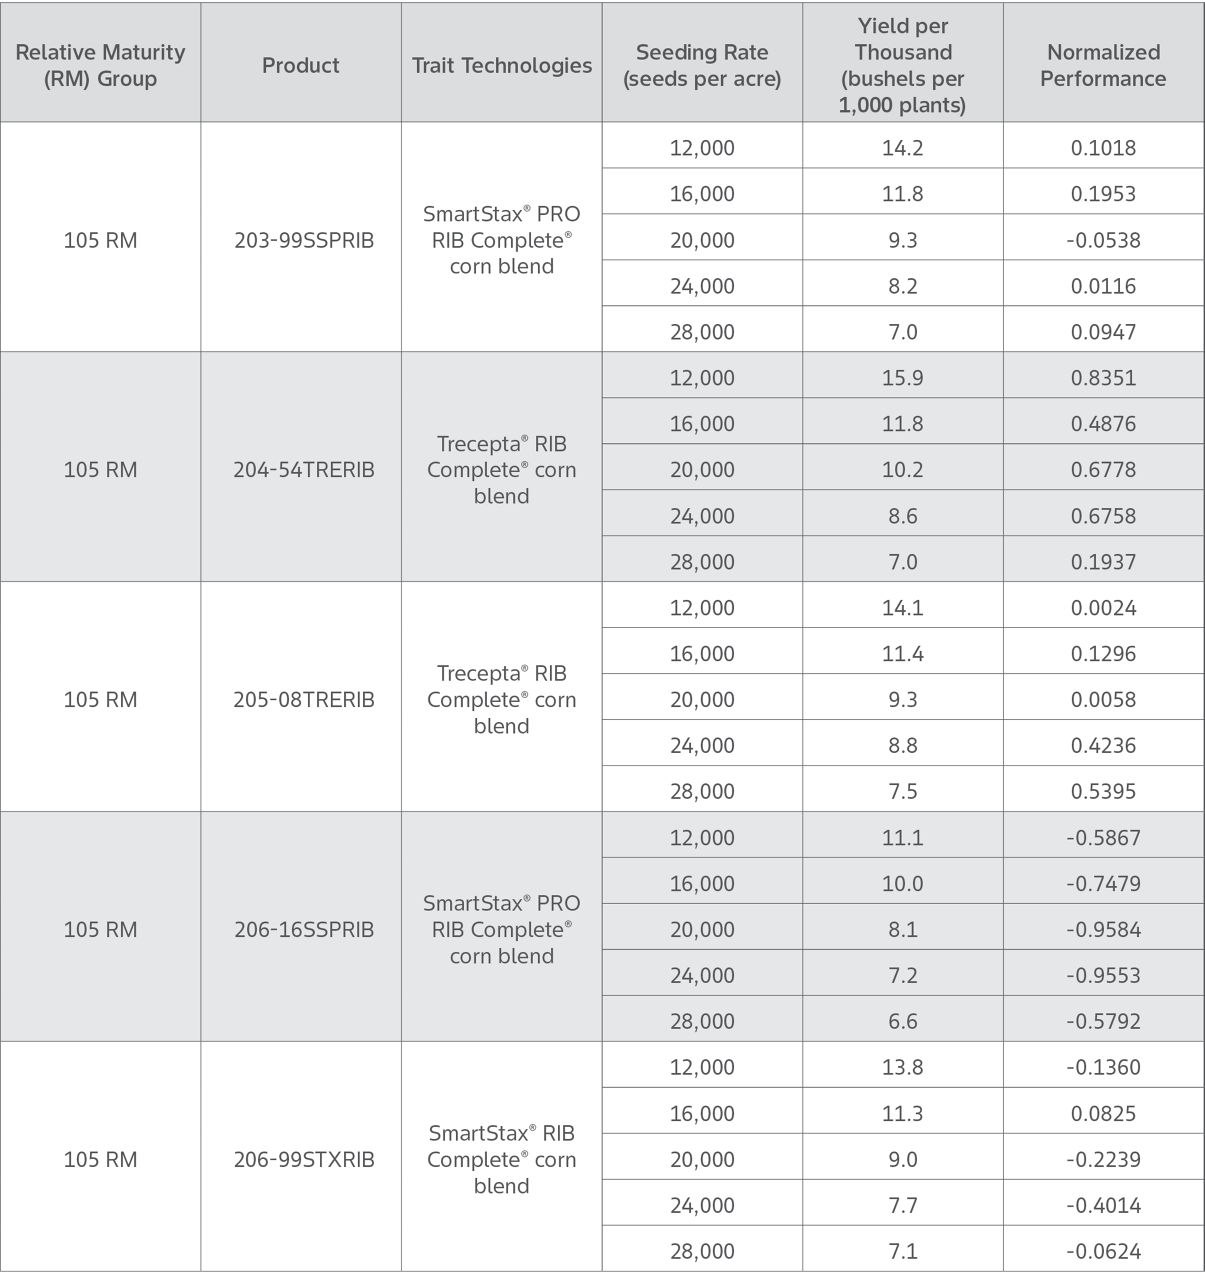
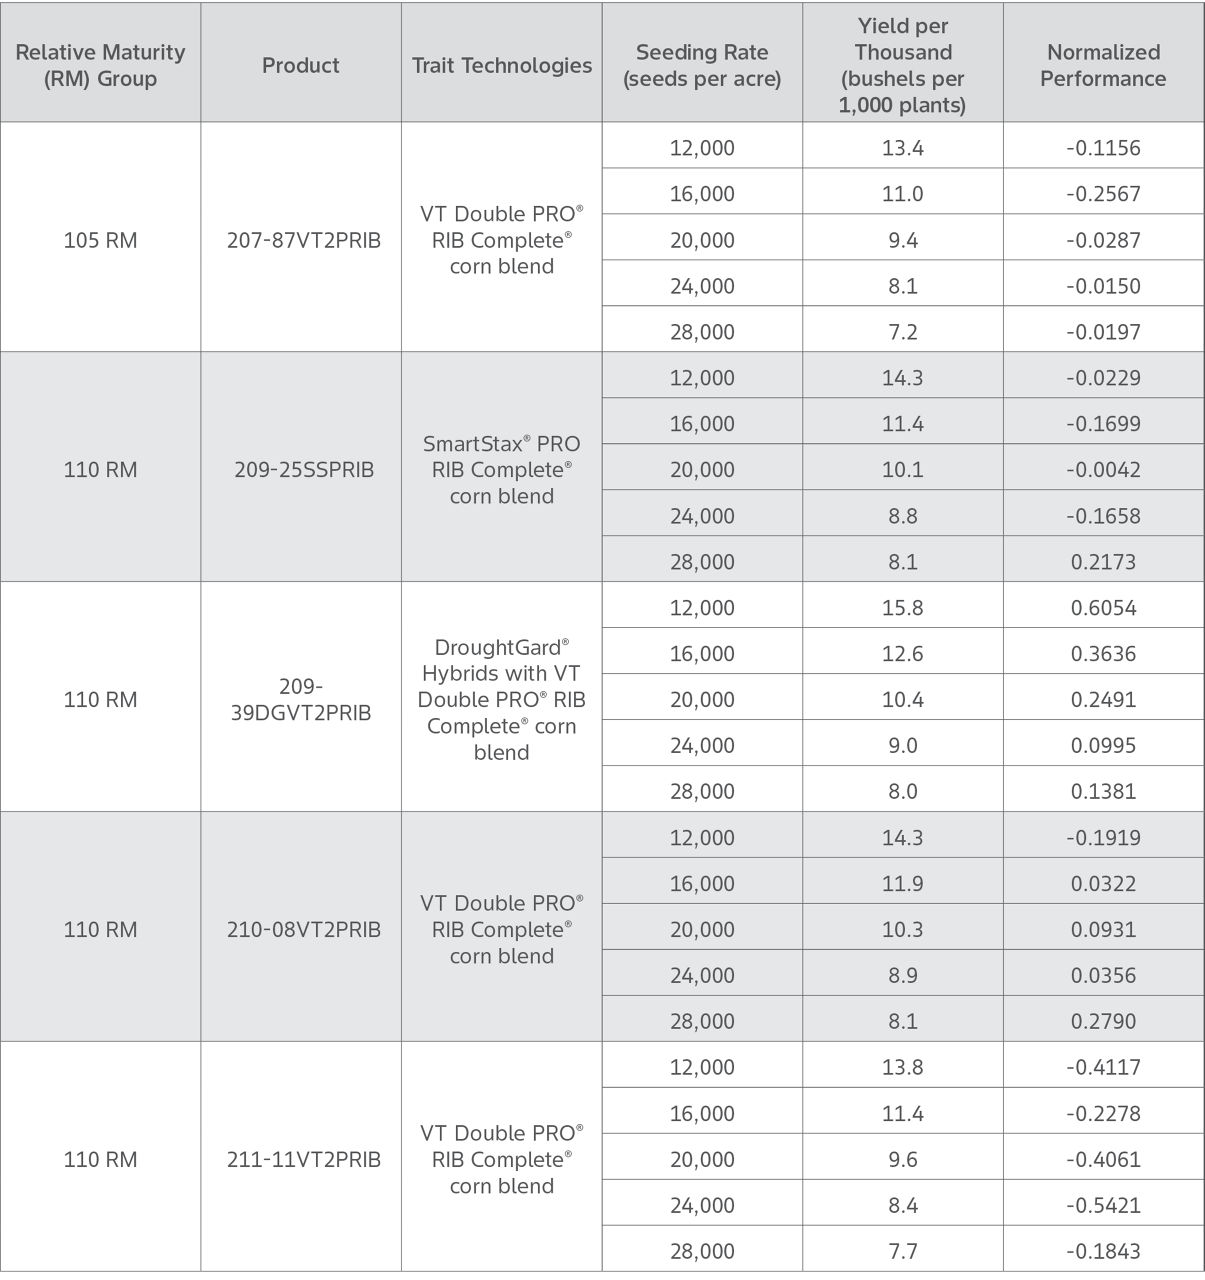
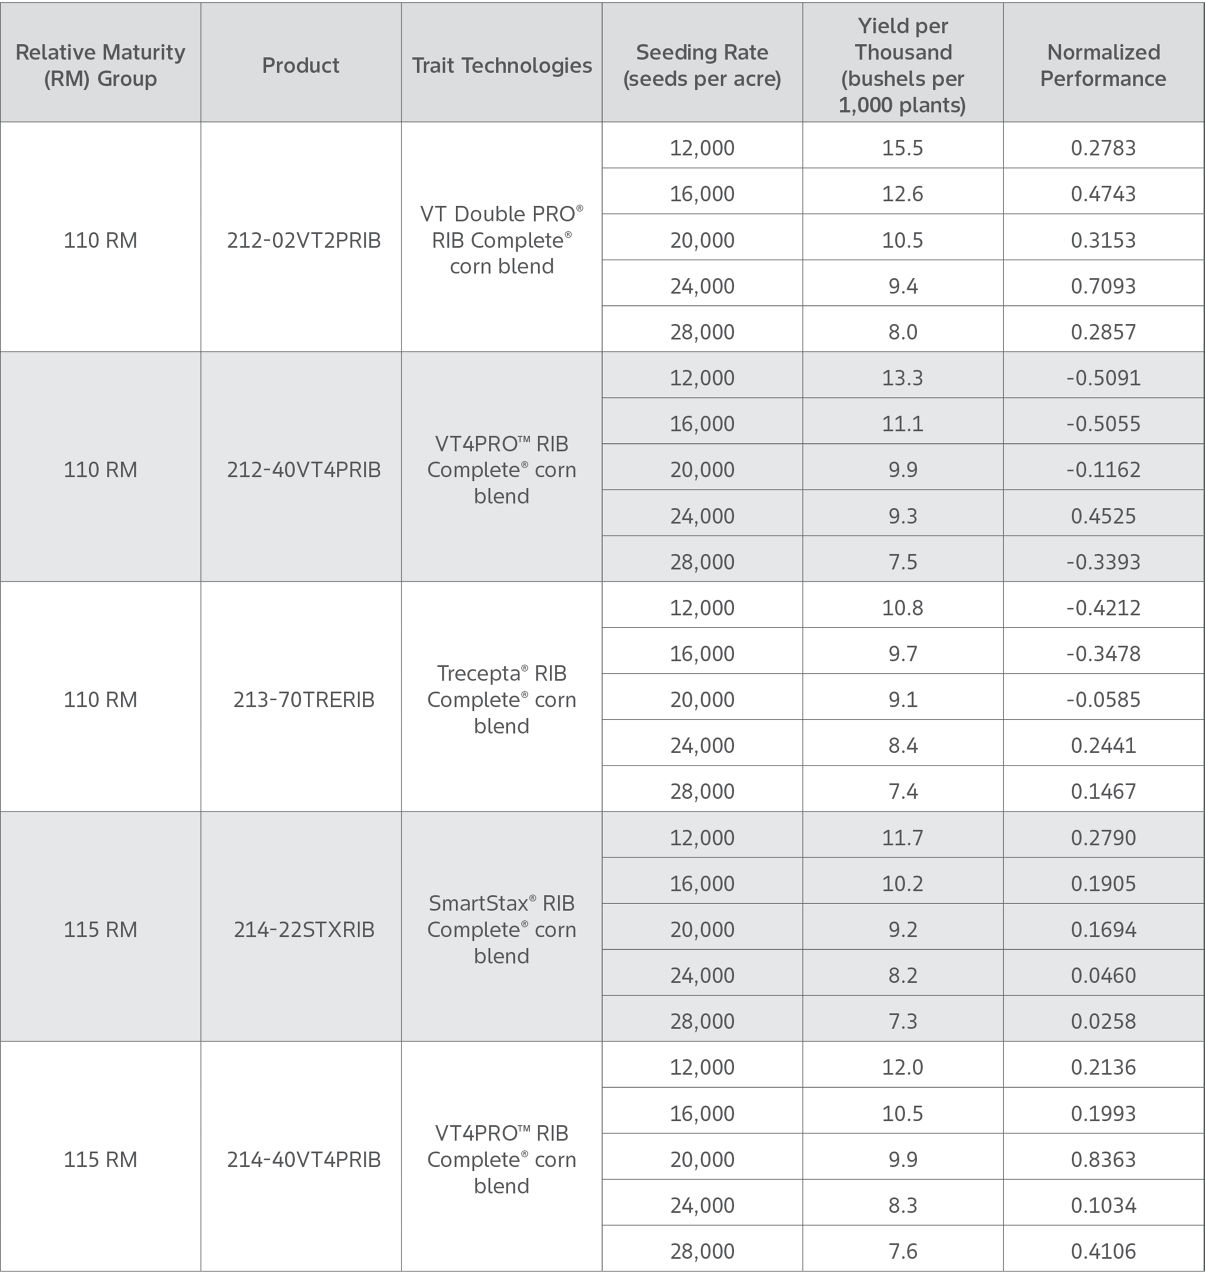
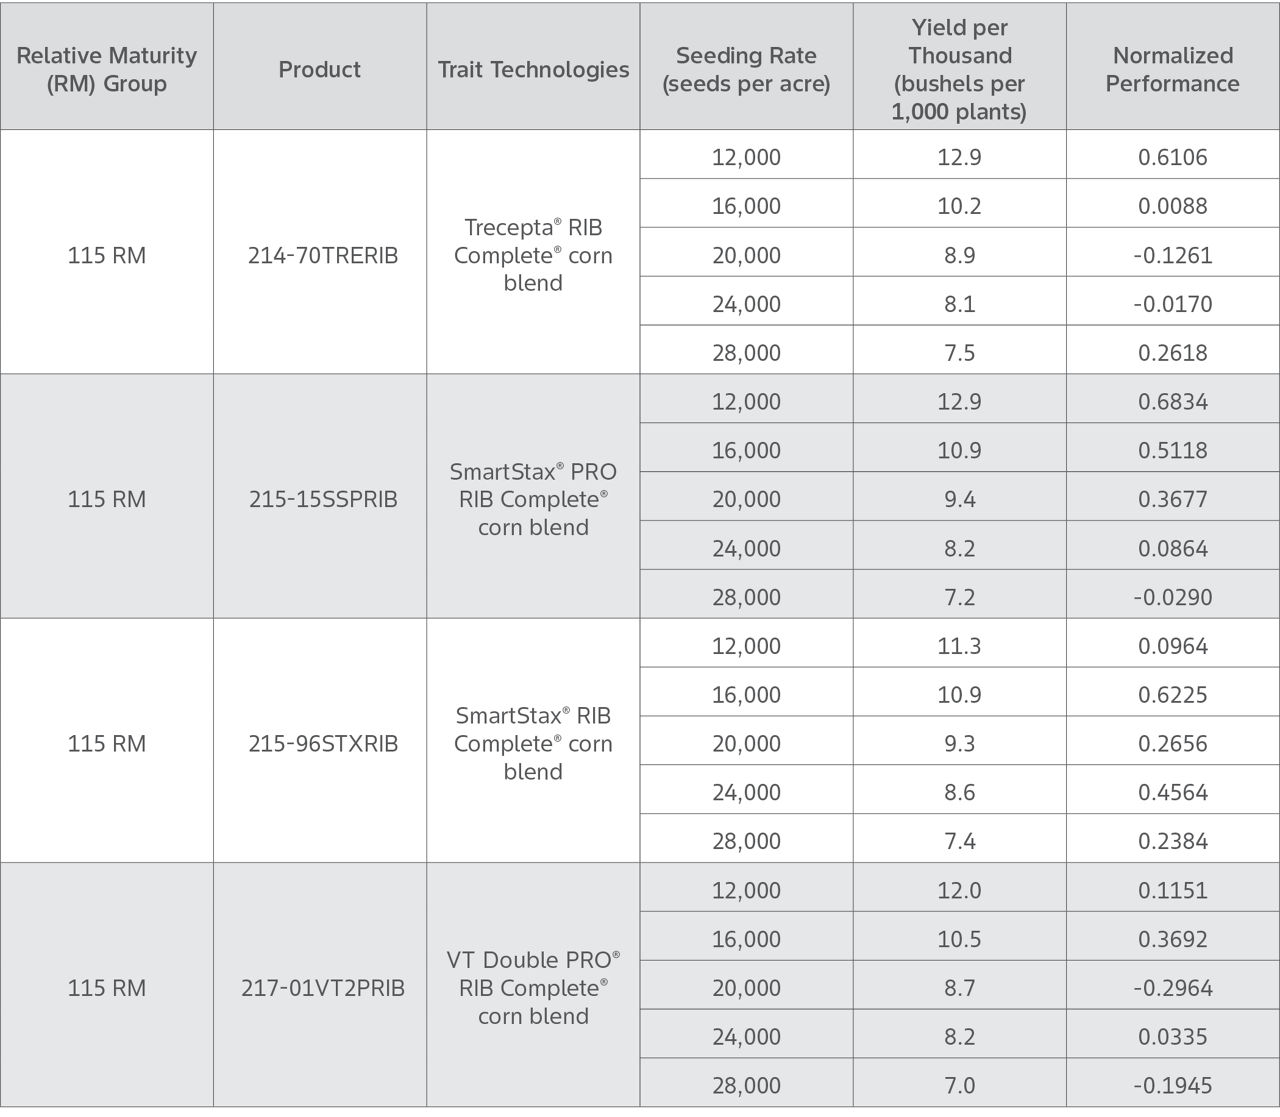
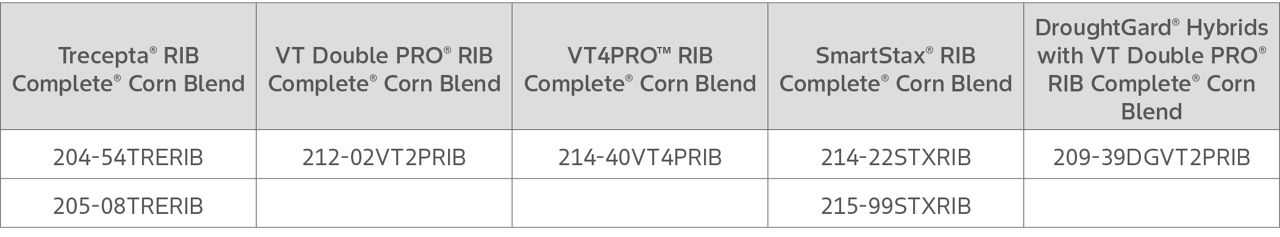
Table 4. Channel® brand corn products, listed by trait technology, that had positive normalized yield data across all seeding densities in this trial in 2025.
The following observations were made from this trial in 2025.
- The 100 RM group had lower yield per thousand (YPT) values compared to the other relative maturity groups tested (Table 3).
- The 100 RM group was tested at only two locations, both of which were not irrigated (Table 2).
- Locations that were not irrigated had lower overall yield potential, likely resulting in lower YPT values for the 100 RM group compared to the other RM groups.
- Yield per thousand values in the 105 RM group ranged from 6.6 to 7.5 bushels per thousand plants at the 28,000 seeds per acre seeding rate, and 11.1 to 15.9 at the 12,000 seeds per acre seeding rate.
- The 110 RM group had YPT values from 7.4 to 8.1 for the 28,000 seeds per acre seeding rate.
- Similar results were observed in the 105 RM group when seeded at 12,000 seeds per acre (Table 3).
- Table 4 lists the Channel® brand corn products that had positive normalized yield data across all seeding densities for this trial.
KEY LEARNINGS
- While a high YPT value indicates more ear flex potential in a product, it does not always result in the highest yield or the most economical planting density.
- The normalized yield data may not indicate which corn product will perform best or which planting density should be used on every field; however, it may help to highlight those products with more consistent performance across various locations.
- Producers should contact their local Channel sales representative for more information about Channel products and seeding rate recommendations.
1210_807051
Disclaimer
ALWAYS READ AND FOLLOW GRAIN MARKETING AND ALL OTHER STEWARDSHIP PRACTICES AND PESTICIDE LABEL DIRECTIONS.