Evaluating Harvest Test Plot and Side-by-Side Data
December 1, 2024
What is a test plot and why are they important? Simply put it is a comparison to help answer many questions:
- What works on my farm with my management and timing, be it a corn or soybean product?
- What yields the most, what is the most consistent?
- What works on high pH?
- What tolerates my soils the best?
- What is best choice for dryland?
- What is the best for irrigation?
- What works the best with all fertility front loaded?
- What works best when nutrients are split applied or spoon-fed?
- Other unknowns?
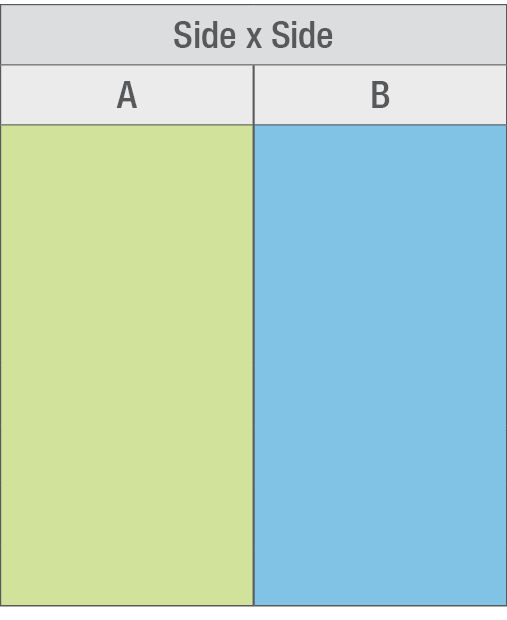
The main consideration is keeping variability within the plot area to a minimum except for the variable you want to evaluate. Can this question be answered with a strip trial or a side by side? A strip trial is a planter or drill pass through the field with entries having an equal number of rows and potentially having the same row length (Table 1). A side by side may be several passes or a single pass next to one or two other seed products but generally covers a larger area than a strip trial (Table 2). It is key to take good records and label every entry in the plot. A labeled stake or flag should be placed in the first row of every entry to identify the product for future visits and harvest. On stakes, consider putting the number of rows planted and an arrow pointing toward their direction. This can help people not associated with the plot to identify each product.
Table 1. Four replication strip plot comparing seed product A to seed product B.
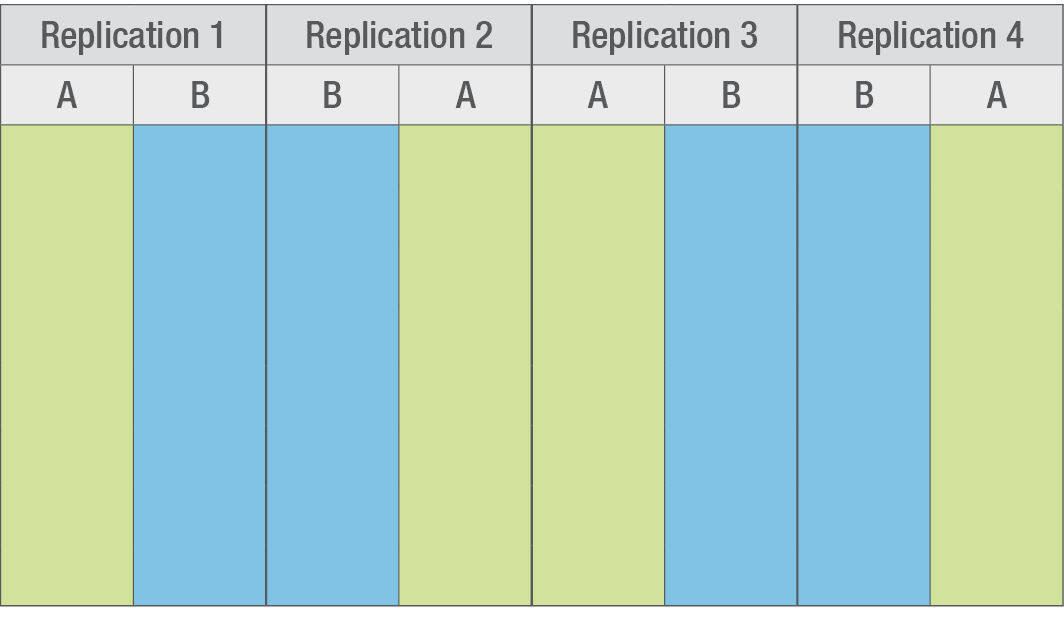
Table 2. Non-replicated side by side comparison of seed product A to seed product B.
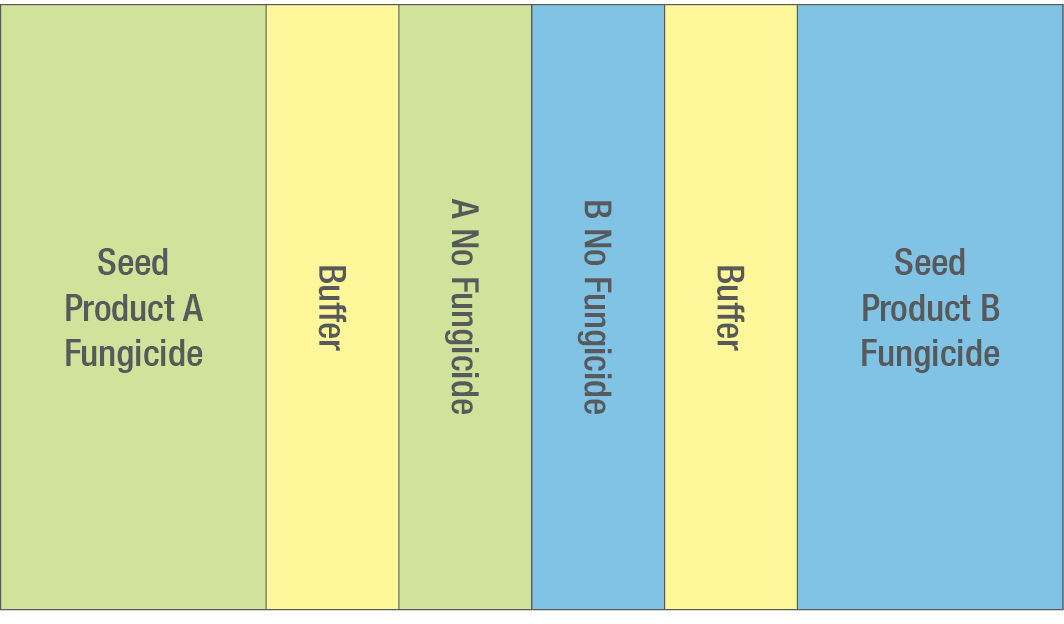
Keys to gaining insights include not overcomplicating an answer by “asking” one question per plot or trial such as what is the effect of a fungicide application on two seed products (Table 3)? Be fair to all products by only changing the thing you want to answer. Keep fertility, number of rows, planting rate, planting date, planting depth, pest management, irrigation timing, etc. the same.
Table 3. Diagram of a trial to compare fungicide application to two seed products.
For a yield strip trial, plant the products in the same field, under the same conditions, and use a calibrated combine yield monitor or a calibrated weigh wagon/grain cart with scales for yield determination. The scales can also help keep harvesting equipment calibrated. Use a portable moisture tester that can measure grain moisture and test weight and take samples from every entry and record the data to help calculate yield accurately and keep harvesting equipment calibrated. If a plot has more than five entries and covers a large area, a familiar seed product should be used as a check and planted before and after every five entries to gauge the performance of the unknown seed products. This same strip-trial setup works to help answer many single variable questions. A side by side is essentially a larger scale strip-trial with less entries. There are many templates available to use a paper form, computer, phone, or tablet to record or perform this yield comparison in the field.
A single plot only measures performance for the trial variable with one site year of weather. It may be very accurate this growing season; however, two growing seasons are never the same. It is best to have more than one location to replicate the same plot at least three times for your farm. If you can coordinate with neighbors, the number of replications may be increases which can result in more data from a larger area and possibly involve different growing conditions. If the same product demonstrates higher productivity across multiple replications within an area, there is a higher probability of higher and stable product performance. You can always ask your local Seed Professional and your local university extension agent for assistance with this task.
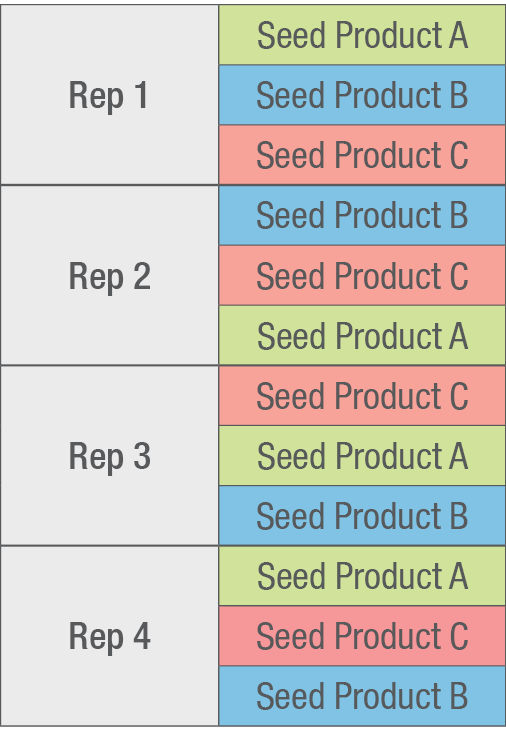
Table 4. Randomized, four replication trial with seed products randomly placed across the plot to help reduce variability.
For initial site selection, make sure the selected field can answer the question you seek to answer and is not too variable that you are not sure what affected the outcome. If you want to find the one product that may work everywhere, they are rare, then a strip trial may suffice. If you are looking to answer a seed product population, genetic potential, or specific management question, a more uniform location is needed.
A population trial can be added to a genetic strip trial as a separate strip for each entry and population. Randomizing the plot entries in a replicated setting in the same field can provide a more robust data set (Table 4). However, multiple locations in a county or surrounding counties can help explain performance results from more than just the past season’s best choice for a seed product.
In my experiences the only thing that is consistent with farming is that every year is different. I understand that on-farm trials usually do not achieve research standards of significance; however, replicated trials within a farming operation and nearby can provide more reliable seed product information. At the very least, three replications should be the minimum for a farming operation. Increasing replications to five or more increases the data reliability. From there you could start to run a better correlated statistical analysis at this level to get more site-year replications. Ideally you would be able to do this over multiple years, but seed products only last three to five years now with the horsepower of modern commercial breeding operations. This puts more reliance on your local Channel® Brand Seed Professional and the good ones are up to that challenge and are willing to build that trust and relationship to help your farming operation be as successful as possible.
Don’t overlook precision agriculture and tools like Climate FieldView™ platform, your equipment suppliers harvest, planting, and pest management software, advanced subscription GIS (geographic information systems) tools, and farm management software. They can help you access field imagery from satellites to assist in scouting, collect data to help build management zones for variable rate seeding and fertility, and build harvest data layers from which to perform yield or treatment analysis (Yield by population, pH, Soil type, rainfall/applied irrigation, etc.). A UAV can also be a useful tool to provide imagery on demand and help with stand counts and scouting fields, structures and equipment to save time and make better informed decisions. Several different brands of farm management software are available with data analysis and GIS engines to help process and manage data to make it more easily understandable. A smart seed firmer can also be a help as it can record soil temperature, pH, and many other things and add to data layers from which to analyze and to build variable rate prescriptions from. Many newer tools now include artificial intelligence (A.I.) to help quickly analyze data and draw meaningful conclusions from. Lastly take the growing season weather into account and consider a weather station to help monitor and record this information for review with the yield data. Again, do not overlook your trusted Seed Professional and local University Extension Agent they can help you here also.
In conclusion, keep your focus on one question and have a purpose to get a measurable outcome for your plot. Make sure your question can be answered by your plot design, and do not unintentionally introduce extra variability that makes the analysis unreliable. Choose the best field and location uniformity for the variability you are trying to manage. Every entry should be treated the same in terms of management and cultural practices to minimize variability. Understand the best setup for what you want to accomplish from either a strip trial or a larger but fewer entry side by side. Keep accurate records and clearly mark the entries with stakes and flags. Use calibrated equipment to measure yield and record the data for later analysis. Strip trials, randomized strip trials, and side by sides help in evaluating the performance of different agricultural practices under similar conditions, reducing the impact of spatial variability. Multiple replications are crucial for detecting differences, ensuring the reliability and validity of the findings in strip trials. Precision AG Solution tools and A.I. can help visualize and make sense of the data to better help with interpretation. Don’t overlook working with your trusted Seed Professional or Extension Agent to better understand your plot data and results.
Channel Agronomist
Brooks Brenn
Sources
Kyveryga, P., Mueller, T., Paul, N., Arp, A. and Reeg, P. 2015. Guide to on-farm replicated strip trials. The Iowa Soybean Association’s On-Farm Network, Ankeny, IA. https://www.iasoybeans.com/pdflibraryuploads/ofn15_farmerfieldguidedigital-v1.pdf
Nebraska on-farm research network. University of Nebraska-Lincoln https://on-farm-research.unl.edu/resources
Ciampitti, I. 2019. On-farm research collaborative project: Non-biased, research-based, and grower-driven. Agronomy eUpdates. Kansas State University Extension, Manhattan, KS. https://eupdate.agronomy.ksu.edu/article/on-farm-research-collaborative-project-non-biased-research-based-and-grower-driven-324-4
Web sites verified 10/9/24 1110_465401
Disclaimer
ALWAYS READ AND FOLLOW GRAIN MARKETING AND ALL OTHER STEWARDSHIP PRACTICES AND PESTICIDE LABEL DIRECTIONS.