Soil Fertility Testing
December 1, 2024
Soil sampling is one of the most important steps for maximizing yield potential. My suggestion is that soil sampling should be completed at a minimum of every crop rotation cycle. Fertilizer is expensive, so the sample cost will be much cheaper than excessive fertilizer. There are three main techniques to soil sampling - composite, grid, and zone. Composite is the combination of multiple soil samples in each field to produce a single sample. Although composite soil samples are not the preferred method, it does provide growers an idea of the fertility level in a particular field. Grid sampling gives the best evaluation of nutrient variation per sample and can be used to apply variable rate fertility. Zone sampling is typically done using a yield map but can be achieved using soil texture. No method is wrong; however, results may vary because of the number of samples collected which can also be dependent on the fall weather.
Soil sampling must be conducted properly to obtain beneficial results. Each sample should be representative of the entire field or area in which it is taken and compared to previous soil tests to make nutrient management decisions. Samples should be taken at the proper depth during the same time frame each year that sampling is conducted and when soils are neither too wet nor too dry. Sample depths can vary by test type but is usually 6 to 12 inches. The soil extraction method used is important in interpreting results because labs may report results in parts per million (ppm) or lb/acre.
To convert ppm to lb/acre, multiply ppm by 2 (lb/acre = ppm x 2).
To convert lb/acre to ppm, divide lb/acre by 2 (ppm = lb/acre ÷ 2).
Comprehensive soil test results include values for organic matter (O.M.), soil pH, cation exchange capacity (CEC), macronutrients, secondary macronutrients, micronutrients, and soluble salts.
Organic Matter
Knowing the O.M. content of a soil is important because of its influence on the biological, physical, and chemical properties of soil. The amount of O.M. can alter nutrient application recommendations. For example, a general guideline is to reduce N applications by 20 lbs/acre for soils with O.M. of 3% or more and increase applications for soils with O.M. of 1% or less. Regional guidelines should be consulted to help determine how O.M. influences nutrient availability within each soil type.
Soil pH
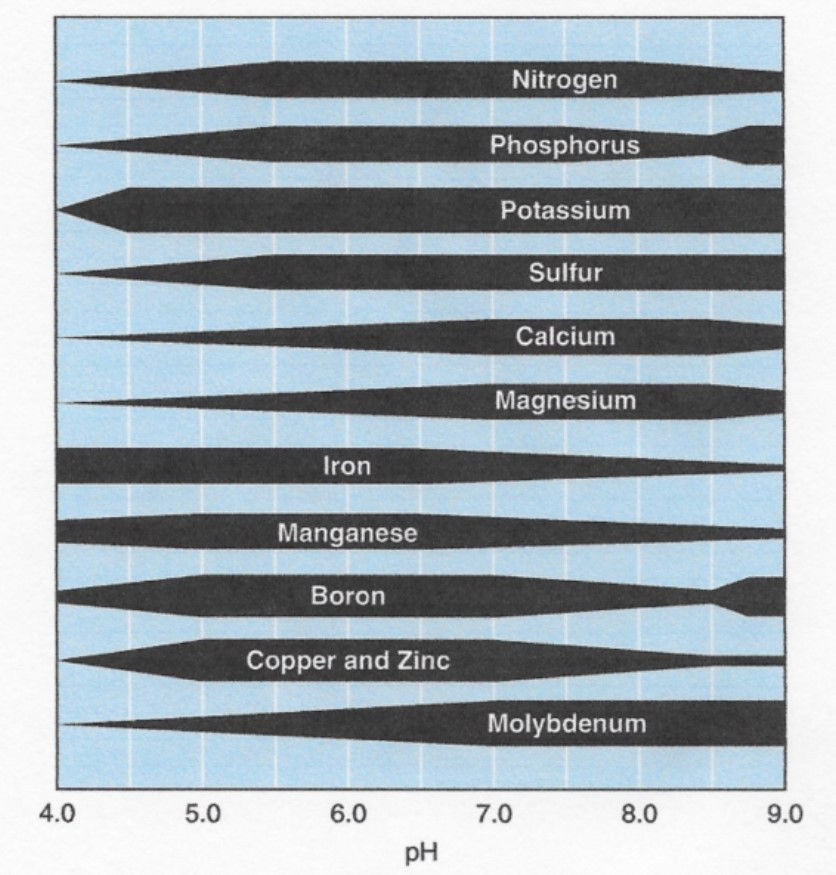
Soil pH is an indicator of soil acidity and alkalinity. The soil pH scale ranges from 0 (acid) to 14 (alkaline), with 7.0 being neutral. Crops generally respond best with a pH between 6 and 7.5. Depending on soil pH, different nutrients can be more or less available (Figure 1). If soil pH is low, lime can be applied to help increase pH to an acceptable level.
Fall is the best time for lime application. Lime neutralizes soil acidity and adds calcium, which is a micronutrient essential for plant growth. Lime takes time to dissolve in the soil and neutralize acidity, so it should be applied about three to six months before planting crops. Applying lime in the fall allows time for it to break down before the next growing season. Lime should be applied and incorporated at least a month before adding fertilizers since it can interfere with the availability of fertilizer nutrients, especially phosphorus. Attention should be given to the different sources of liming material. Products vary in their neutralizing efficiency (calcium carbonate equivalent and particle size composition) and can influence optimum lime application rates. Most states test and publish the percentage of lime passing through several different mesh sizes. The smaller the mesh size the faster lime will react.
Cation Exchange Capacity
The CEC is not always part of a soil analysis; however, it should be because it measures the soils capacity to hold positively charged particles (cations) such as K+, NH4+, Cu2+, Fe2+, and Mn2+. Cation exchange capacity and soil clay content are often correlated. A CEC value less than 12 is a good candidate for spring applied fertilizer because of high likelihood of nutrient loss.
Phosphorus (P) and Potassium (K)
Fall is typically the best time for making P and K applications because of workload, dry soils, and availability of fertilizers. However, granular fertilization can be applied in season if fall applications cannot be achieved. Fall is also a good time to apply P for environmental reasons since there is generally a lower risk of P runoff with the typical fall weather and soil conditions. Phosphorus and K fertilizers should not be applied on frozen ground because applications made to fields with any slope can result in runoff and fertilizer loss.
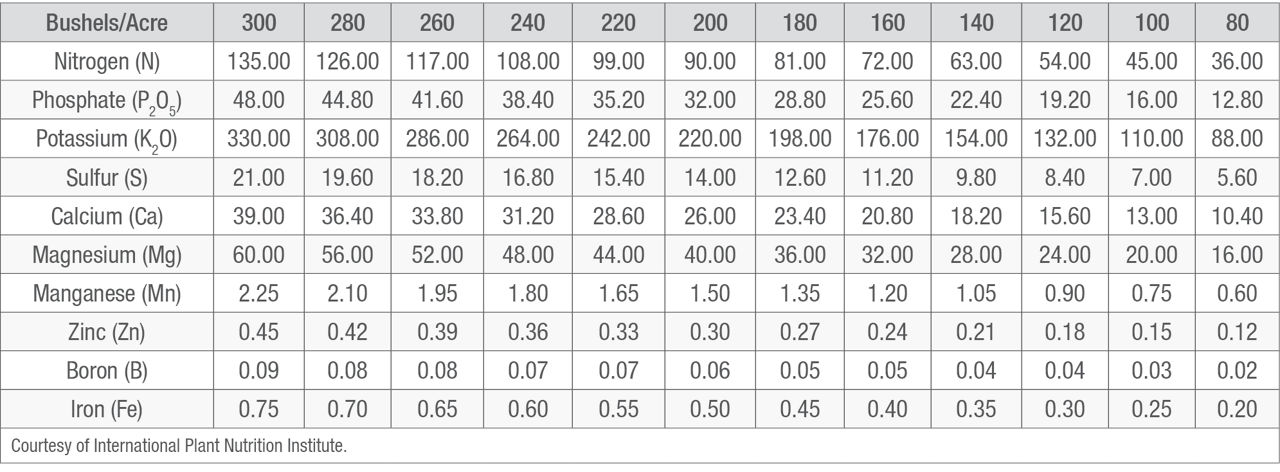
At planting applications can be advantageous if conditions are favorable and especially in high pH situations. High pH values can tie up essential nutrients; therefore, in-season applications can allow for crop uptake rather than soil tie-up. Soil test recommendations should be followed to maintain P and K above their respective critical levels. These levels help the soil supply adequate nutrient quantities to help optimize plant growth potential. When maintaining P and K levels, replace what is used by the crop each year. A rule of thumb is each bushel of corn harvested removes the equivalent of about 0.37 pounds of phosphorus oxide (P2O5) and 0.28 pounds of potassium oxide (K2O) with the wide range of crop yields every year, this is important to consider when determining the amount of maintenance fertilizer to apply (Table 1). Because much of the P and K are stored in crop residue, silage crops remove more nutrients (Table 2).
Table 1. Nutrients removed by grain.
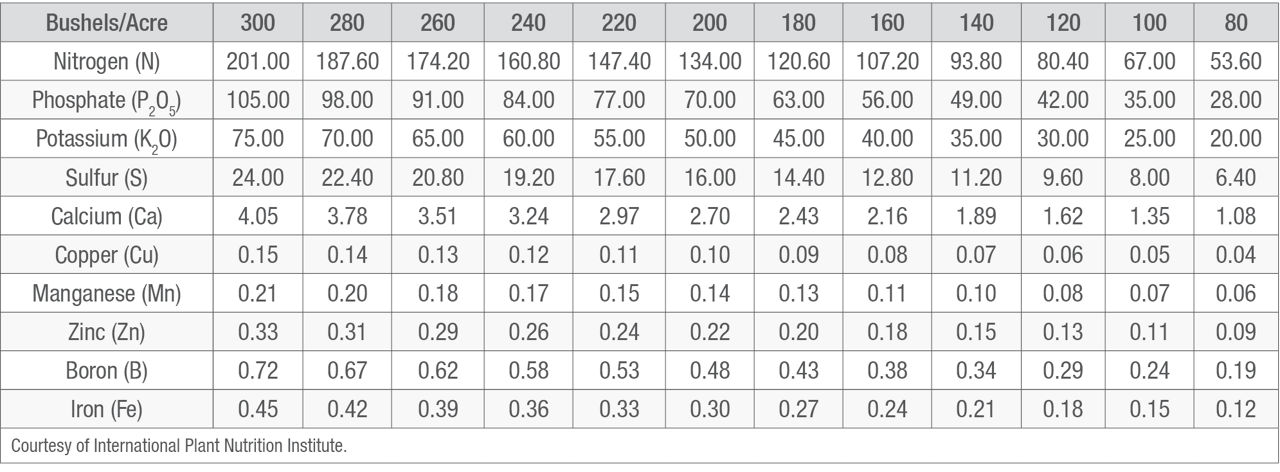
Table 2. Nutrients removed by corn stover.
Operating at low soil test levels of these nutrients may reduce yield potential, especially with K If soil tests show these nutrients to be above the critical levels, applications are not necessary for the next crop. It is common to apply P and K fertilizer in blends along with other needed nutrients such as sulfur (S) and zinc (Zn). Recommended rates of fertilizer should be applied annually to soils that are below critical levels of these nutrients. The annual applications include P and K soil build-up and crop removal needs.
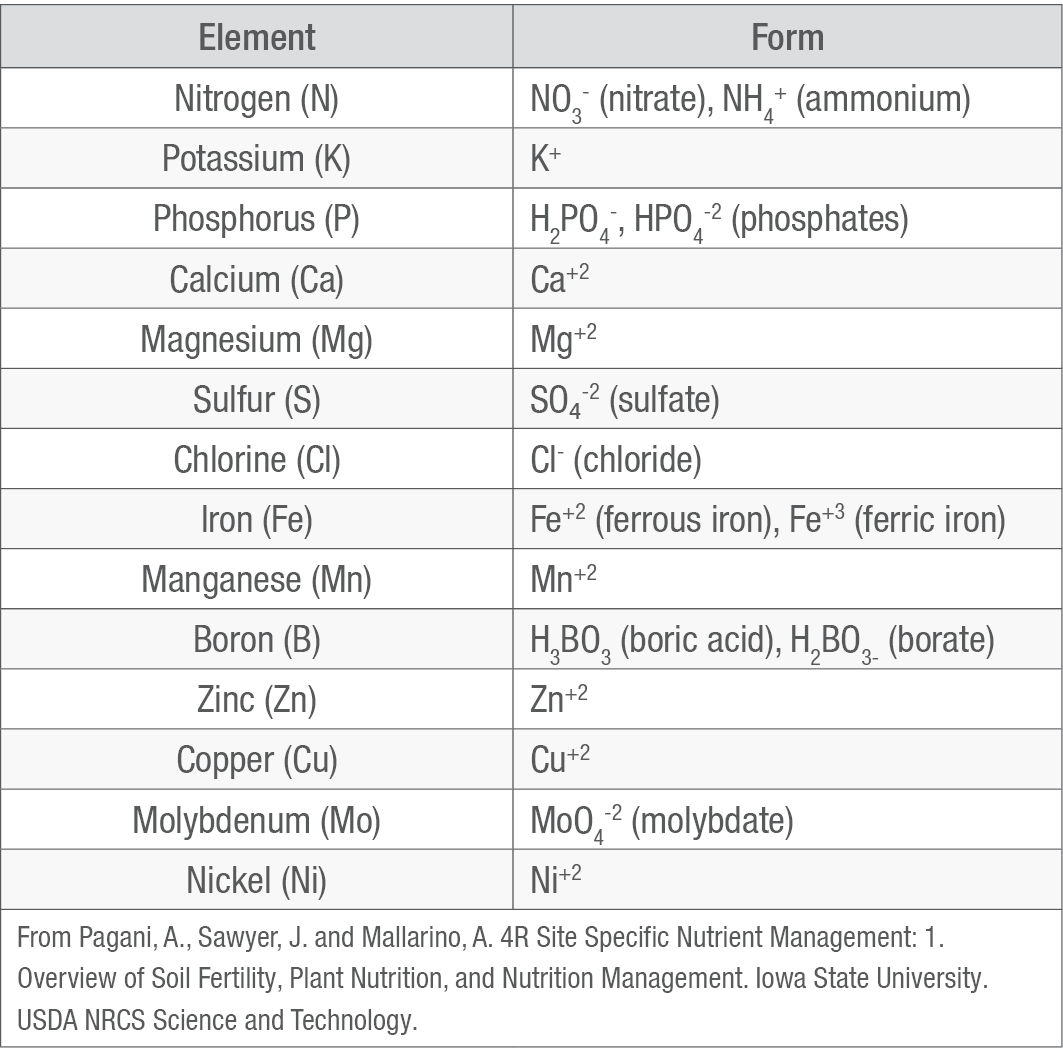
The most popular form of K is in the form of Muriate of Potash (0-0-60). The most popular forms of P are Monoammonium phosphate [(MAP) (11-52-0)], Diammonium phosphate [(DAP) (18-46-0)], and Triple superphosphate [(TSP) (0-46-0)] (Table 3). TSP is typically used most when P is applied in the fall or when applying P to a legume crop due to lack of N which is a biproduct associated with the other sources of P. These are often applied in the fall using a calibrated spreader buggy but can also be broadcast using a crop-dusting airplane or drone. All these forms are available in granular form but can also be broken down in liquid solution.
Table 3. Nutrient uptake forms.
Nutrient Applications
Nitrogen (N)
Fall applied N should only be applied in the form of anhydrous and when soil temperatures are less than 50 °F and when soils are not too wet or too dry because the knife slots may not close. Poor slot closing can result in lost N to the atmosphere. Fall applied anhydrous may have logistic and economic advantages compared to spring applications. Disadvantages include the potential loss of N between application and crop use due to leaching. Nitrogen in the forms of urea or liquid urea ammonium nitrate are good N sources. Urea is often broadcast applied but should be treated or incorporated within three days of application to avoid N losses. Generally, liquid UAN is sidedressed but can be surfaced applied at planting. Urea and UAN should not be used in the fall due to increased risks of loss (volatilization, leaching, and denitrification) when compared to anhydrous.
Liquid Fertilizer
The use of liquid fertilization at planting is a fairly common practice. These applications are attached to the planter and applied two inches to the side and two inches below the seed, hence the name 2X2.
Channel Agronomist
Richard Turner
Sources
Dinkins, C.P. and Jones, C. 2013. Interpretation of soil test results for agriculture. MT200702AG. MontGuide. Montana State University Extension. http://landresources.montana.edu/soilfertility/documents/PDF/pub/InterpSoilTestMT200702AG.pdf.
Mallarino, A.P., Sawyer, J.E., and Barnhart, S. 2013. A general guide for crop nutrient and limestone recommendations in Iowa. Iowa State University Extension. Publication No. PM1688. https://store.extension.iastate.edu/product/A-General-Guide-for-Crop-Nutrient-and-Limestone-Recommendations-in-Iowa.
Pagani, A., Mallarino, A.P., and Sawyer, J.E. 2009. Soil pH and lime management for corn and soybean: an ongoing on-farm project. Iowa State University. (Presented at North Central Extension-Industry Soil Fertility Conference 2009. Vol. 25 Des Moines, IA). http://www.agronext.iastate.edu/soilfertility/info/NC09Paganipg106.pdf.
Mallarino, A.P. and Sawyer, J.E. 2013. Interpretation of soil test results. PM 1310, Iowa State University Extension and Outreach. https://dr.lib.iastate.edu/entities/publication/48d7984f-0c68-484b-a255-c22cc256414c
Pagani, A., Sawyer, J. and Mallarino, A. 4R Site Specific Nutrient Management: 1. Overview of Soil Fertility, Plant Nutrition, and Nutrition Management. Iowa State University. USDA NRCS Science and Technology. https://conservationwebinars.net/webinars/4r-nutrient-stewardship-ch1-overview
Web sites verified 10/30/24 1110_465401
Disclaimer
ALWAYS READ AND FOLLOW GRAIN MARKETING AND ALL OTHER STEWARDSHIP PRACTICES AND PESTICIDE LABEL DIRECTIONS.