Crop ScienceUnited States
Evaluating Corn Agronomics According to Nitrogen Rates and Cover Crop Mix Selection
March 26, 2025
TRIAL OBJECTIVE
- Cover crops serve as an alternative method for introducing nitrogen (N) into cropping systems by facilitating atmospheric N fixation through legume species.
- Managing N fertilization in cropping systems with diverse cover crop mixtures can be challenging. Some cover crops have a high carbon-to-nitrogen ratio (C:N), which may lead to N immobilization.
- The objective of this trial was to evaluate corn agronomic parameters according to cover crop mixes and N management.
RESEARCH SITE DETAILS

- The trial was arranged as a randomized complete block design including four replications with two treatment factors (Table 1).
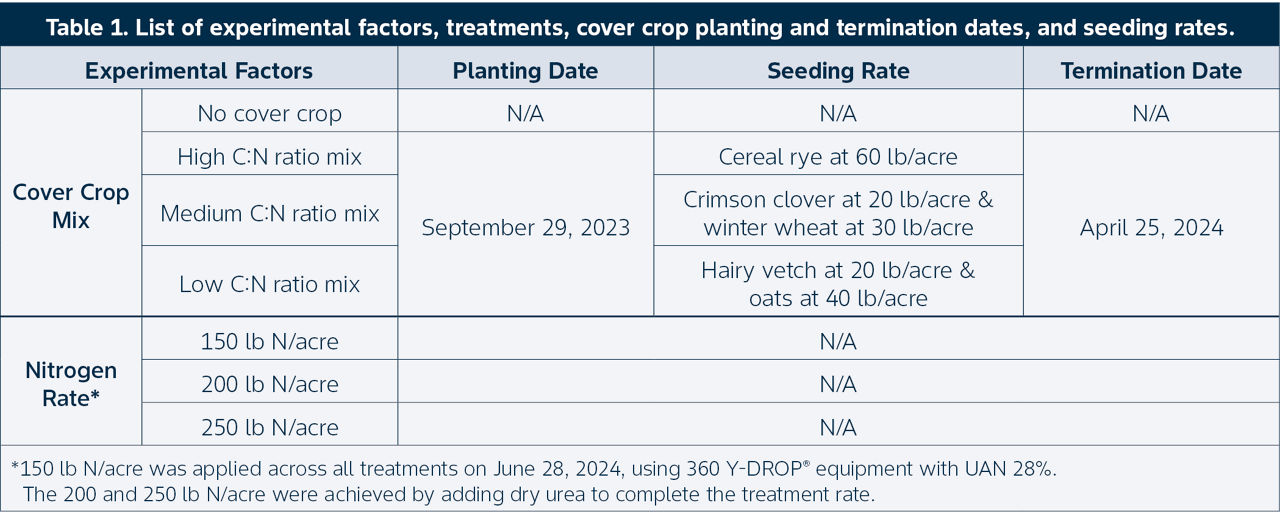
- Cover crop mixes were classified according to their C:N ratio. Generally, mixtures with a higher proportion of grasses than legumes have a higher C:N ratio, leading to slower decomposition and prolonged N immobilization. Conversely, mixtures dominated by legumes have a lower C:N ratio, resulting in faster decomposition and quicker N release into the soil.1
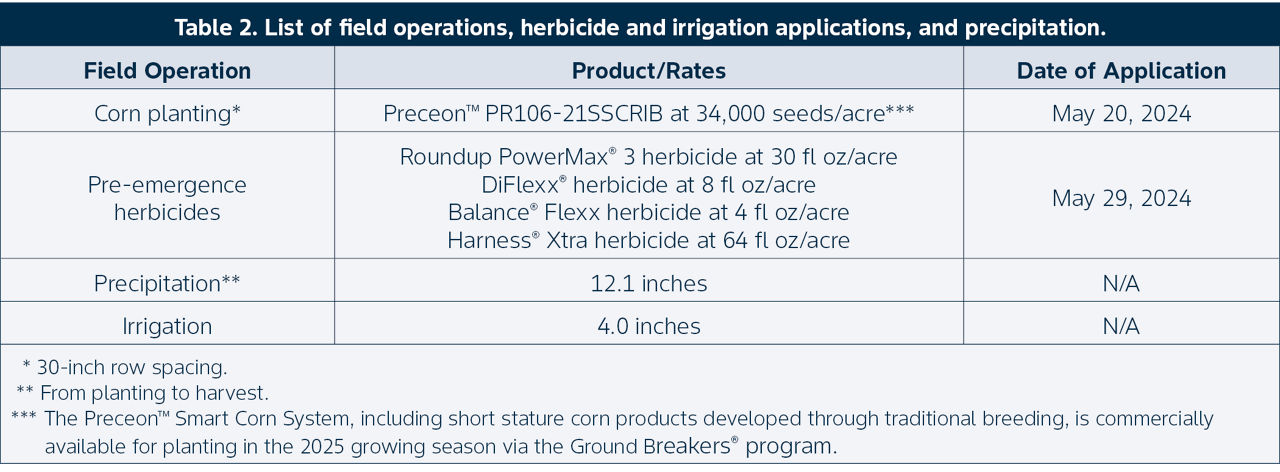
- Field operations, corn product, herbicide, irrigation, and precipitation information are listed in Table 2.
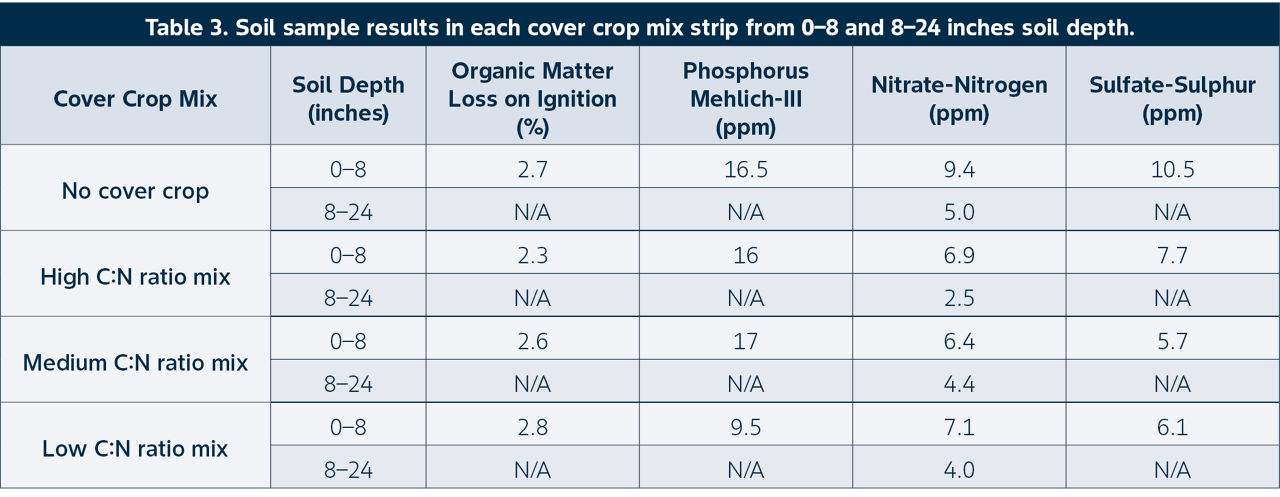
- Soil samples from each cover crop strip were taken when corn reached the V4 growth stage, and the results are displayed in Table 3.
- Normalized Difference Vegetative Index (NDVI) was collected using a Trimble® handheld device when corn reached the V4 growth stage.
- Plant height, ear height, and final plant population were measured when corn reached the R4 growth stage.
- Total weight, test weight, and moisture content were collected with a plot combine and yield per acre was later calculated.
- Statistical analysis for Fisher’s Least Significant Difference (LSD) was performed.
UNDERSTANDING THE RESULTS
Corn Normalized Difference Vegetative Index (NDVI), and final corn stand count.
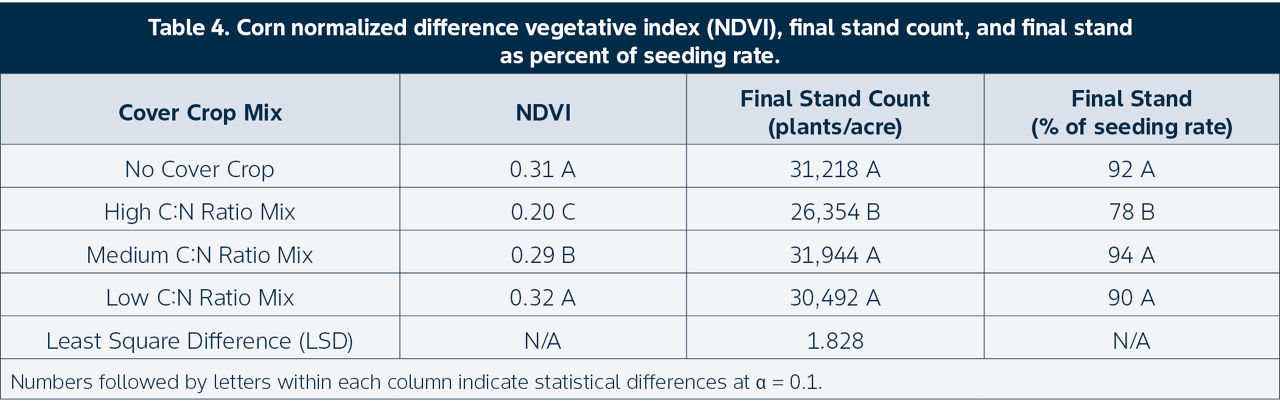
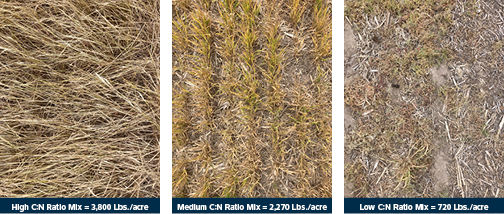
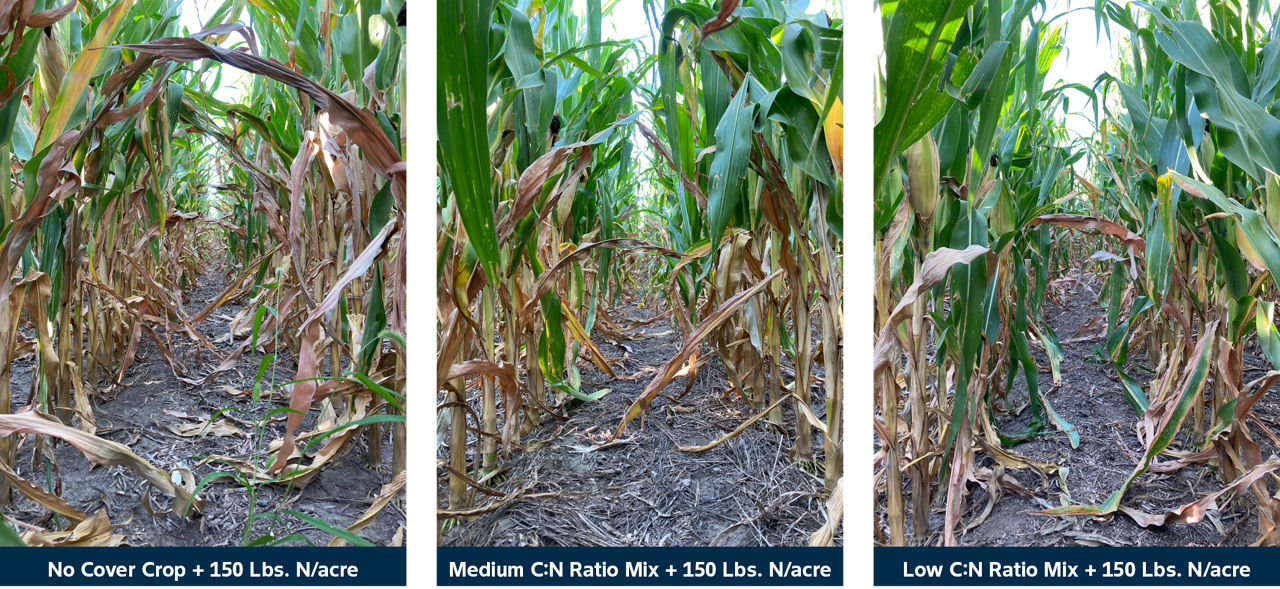
- High and medium C:N ratio mixes produced more cover crop biomass per acre (Figure 1) and reduced NDVI readings on corn compared to no cover crop and low C:N mix (Table 4). Lower NDVI readings indicate a lower corn biomass and/or N content on those plants.
- The high C:N ratio mix had the lowest final stand count compared to all other treatments (Table 4). The high C:N ratio mix, composed by cereal rye only, achieved a final stand of 78% of the seeding rate (26,354 plants/acre from 34,000 seeds/acre planted). Lower corn final stand counts could be due to excessive cover crop biomass production making corn planting operations more difficult.
Corn Plant and Ear Height
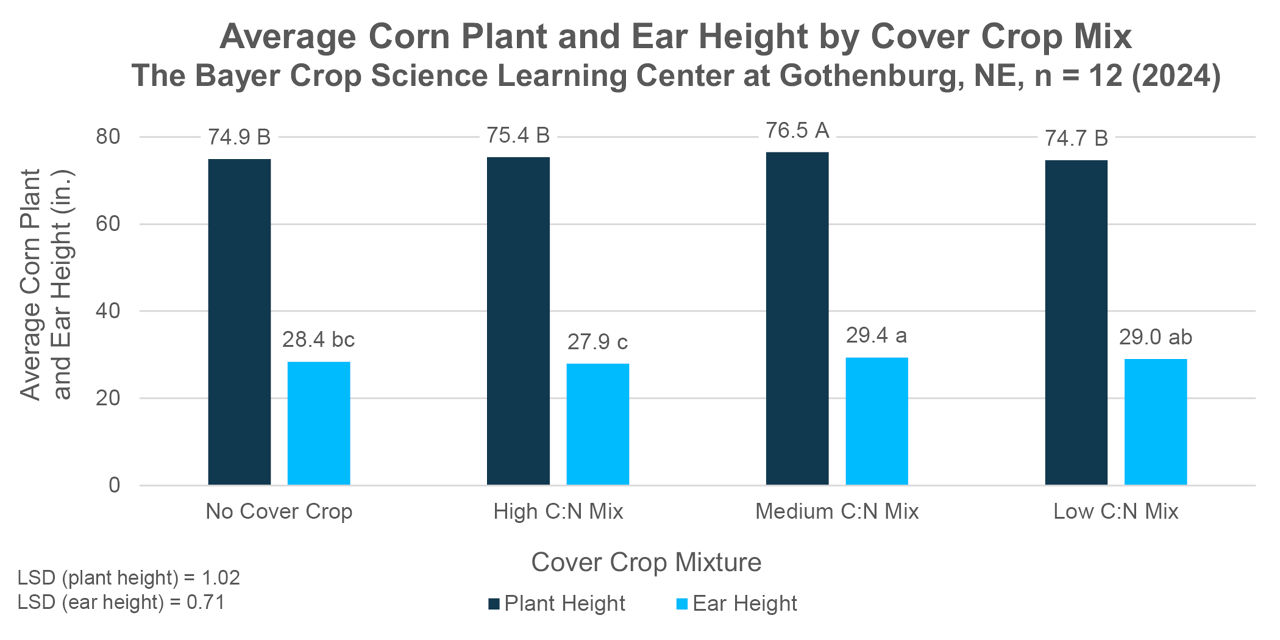
- The medium C:N ratio cover crop mix produced the highest average plant height (76.5 inches) when compared to all other treatments and produced a higher average ear height (29.4 inches) than the high C:N ratio mix (27.9 inches) and the no cover crop treatment (28.4 inches). The average ear height (29.4 inches) in the medium C:N ratio mix was similar to the low C:N ratio mix (29.0 inches) (Figure 2).
Corn Grain Yield
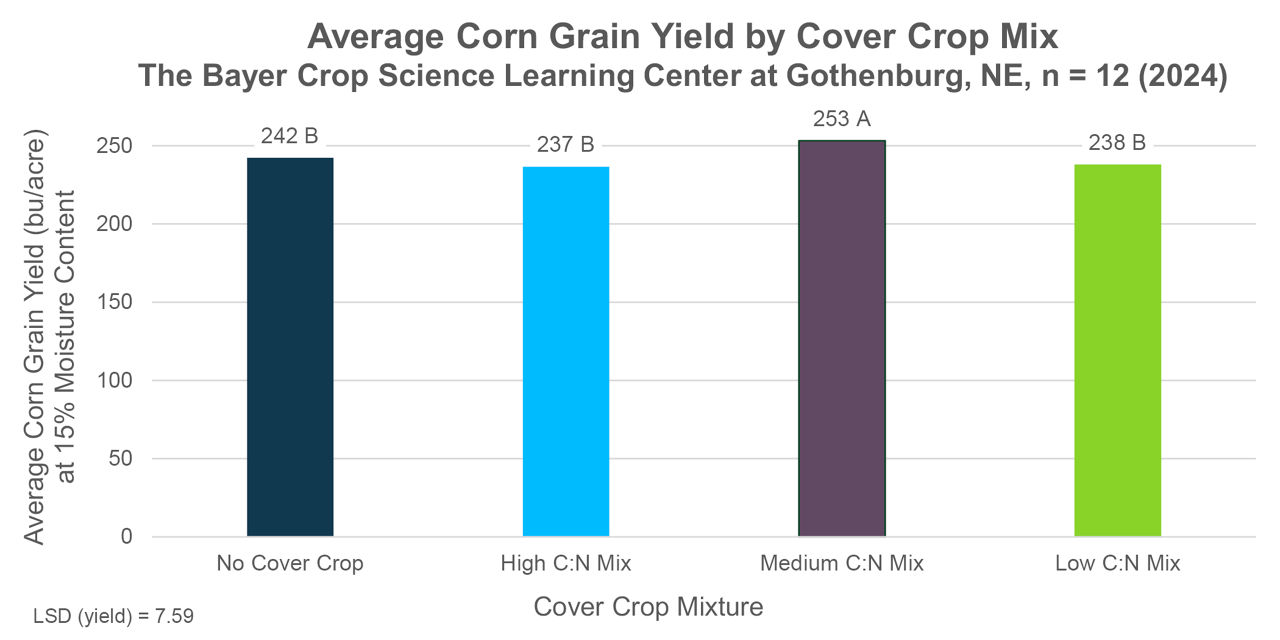
- The medium C:N ratio mix had the highest average corn grain yield (253 bu/acre) compared to all other treatments (Figure 3).
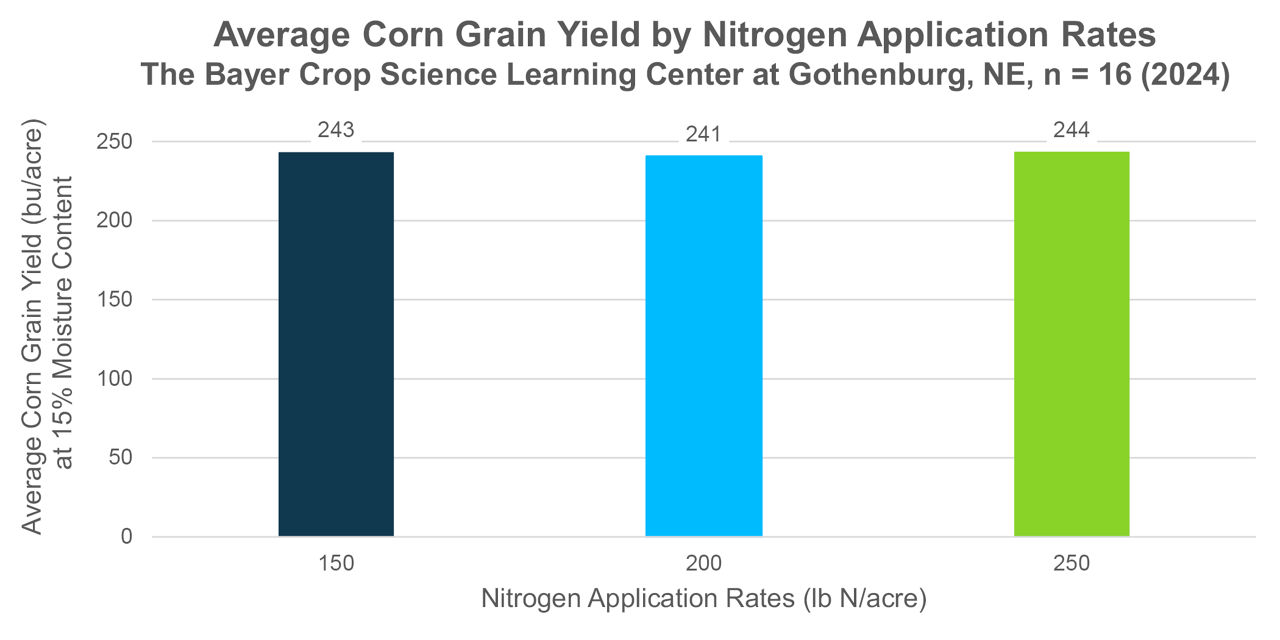
- In this study, the three N rate treatments did not produce statistically significant differences in any of the evaluated parameters (Figure 4).
KEY LEARNINGS
- A balanced C:N ratio mix can achieve a reasonable cover crop biomass, helping to decrease the risk of N immobilization while suppressing weeds and cycling nutrients.
- High C:N ratio cover crop mixes can induce N immobilization. Opting for a low (or eventually a medium) C:N ratio cover crop mix may help mitigate N stress effects in corn.
- Excessive growth of grass cover crops can impact corn plant stands. Incorporating legumes or cover crop mixes that include legumes is a recommended option before planting corn. To manage excessive grass biomass, consider terminating it early or using a roller crimper to flatten it.
- Understanding N rate calibration for different cover crop mixtures remains essential. The Bayer Crop Science Learning Center at Gothenburg, NE will continue researching this topic.
- Visit with your local Bayer agronomist for more information about cover crop and N management.
Sources
1Ruark, M. and Franzen, D. 2020. Nitrogen availability from cover crops: Is it always about the C:N ratio? Crops & Soils. 53(1): 3–7. https://doi.org/10.1002/crso.20003
Web sources verified 03/06/25. 1213_516151
Disclaimer
ALWAYS READ AND FOLLOW GRAIN MARKETING AND ALL OTHER STEWARDSHIP PRACTICES AND PESTICIDE LABEL DIRECTIONS.