3 MIN READ
Black Layer in Corn Helps Guide Harvest Timing
August 5, 2026
Get Year-Round Updates From Our Agronomic Experts
- Corn black layer formation signals the plants’ physiological maturity.
- After black layer formation, kernel test weight is finalized and drydown begins.
- Harvest timing can be estimated based on black formation.
The ideal time to harvest a corn crop depends on its physiological maturity, crop condition, grain moisture content, and the cost of grain drying for on-farm storage or marketing. Physiological maturity occurs at black layer (Figure 1) and is discussed below. Crop condition includes standability, ear attachment soundness, insect and disease impact on the crop, and environmental stress. Drying grain to acceptable short- or long-term storage levels can be expensive and should weigh heavily on the decision of when to harvest.
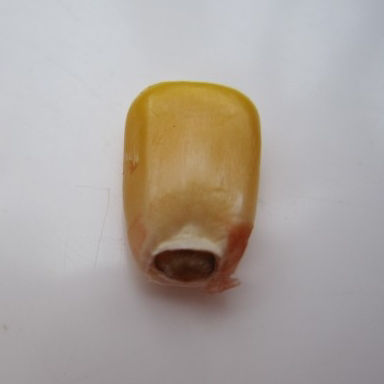
Corn Black Layer or Physiological Maturity
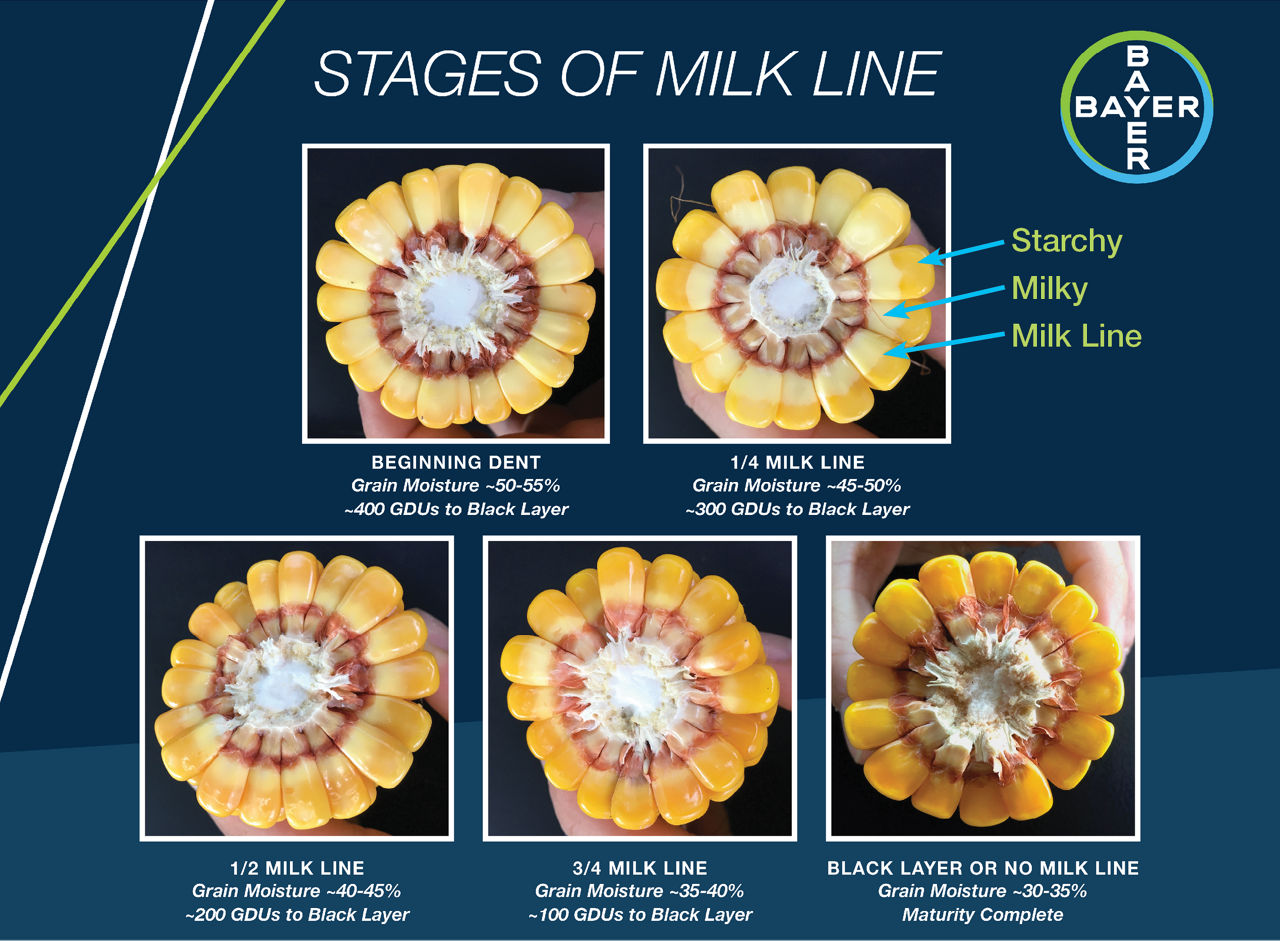
The plant’s journey to physiological maturity begins at germination and progresses to the point of black layer formation. After pollination and embryo fertilization, each kernel starts to develop and proceeds through various stages of being very milky, to varying ratios of milk to starch, and finally to full starch (Figure 2).
A corn kernel’s potential test weight reaches its maximum value when the kernel tip develops a black film or layer. The black layer seals the kernel from the rest of the plant, preventing it from acquiring more assimilates (nutrients and water) and signifying physiological maturity for the plant. The black layer can form when the corn plant reaches its productive life based on growing degree units (GDUs), growing degree days (GDDs), or relative maturity (RM), or after environmental or physiological stress. Environmental stress may include heat, drought, an early killing frost/freeze, or hail injury. Physiological stress may include premature plant death from insect feeding or disease development. The kernel moisture content at black layer usually ranges from 25% to 40% with an average of around 30%.1,3 (Note that GDUs and GDDs are essentially the same and are used interchangeably. This document uses GDUs during the discussion).
Physiological maturity is greatly influenced by the RM of the individual corn product. Short-season products mature earlier than fuller-season products. This genetic characteristic allows for the selection and planting of different corn products to spread out the maturation of a farming operation’s corn crop. This helps with harvest scheduling, as all corn acres are not maturing at the same time and so do not require simultaneous harvesting.
Environmental stress such as drought and cool weather can affect maturation timing. Severe drought can cause premature death and black layer formation, particularly if the ears droop early and the shank is pinched. Cool weather can delay maturation because growing degree units accumulate slower at lower temperatures. If the growing season has been very cool and GDUs are slow to accumulate, maturation may not naturally occur before a killing frost. If black layer has not occurred prior to a killing frost, a black layer finally forms after frost-induced death. However, the rate of kernel moisture content may require an additional 4 to 9 days of field drying to reach 22 to 30% kernel moisture content on the amount of milk and starch content and environmental conditions.3 The rate of kernel moisture loss of frost-damaged corn should be near that of corn that was not prematurely killed. The amount of kernel moisture content loss is dependent on the plant’s growth stage at the time of the killing frost. Moisture content is higher at R4 (mid-dough) than R5.5 (half-milk line).3 The impact on grain quality and test weight is also dependent on growth stage and the severity of the frost.
Growing degree units are calculated by determining the mean daily temperature (the average of the day’s high temperature and low temperature) and subtracting the base temperature for favorable corn growth (Tbase, which is 50 °F) from that. Therefore, the GDU formula is: GDU = (Tmax + Tmin)/2 −Tbase.
The upper temperature limit for favorable corn growth is 86 °F and the lower limit is 50 °F. Because corn plants can only accumulate GDUs when temperatures are between these upper and lower limits, if the high temperature (Tmax) for the day is above 86 °F, 86 is used for the GDU calculation. If the low temperature (Tmin) for the day is below 50 °F, 50 is used for the calculation.4,5,6
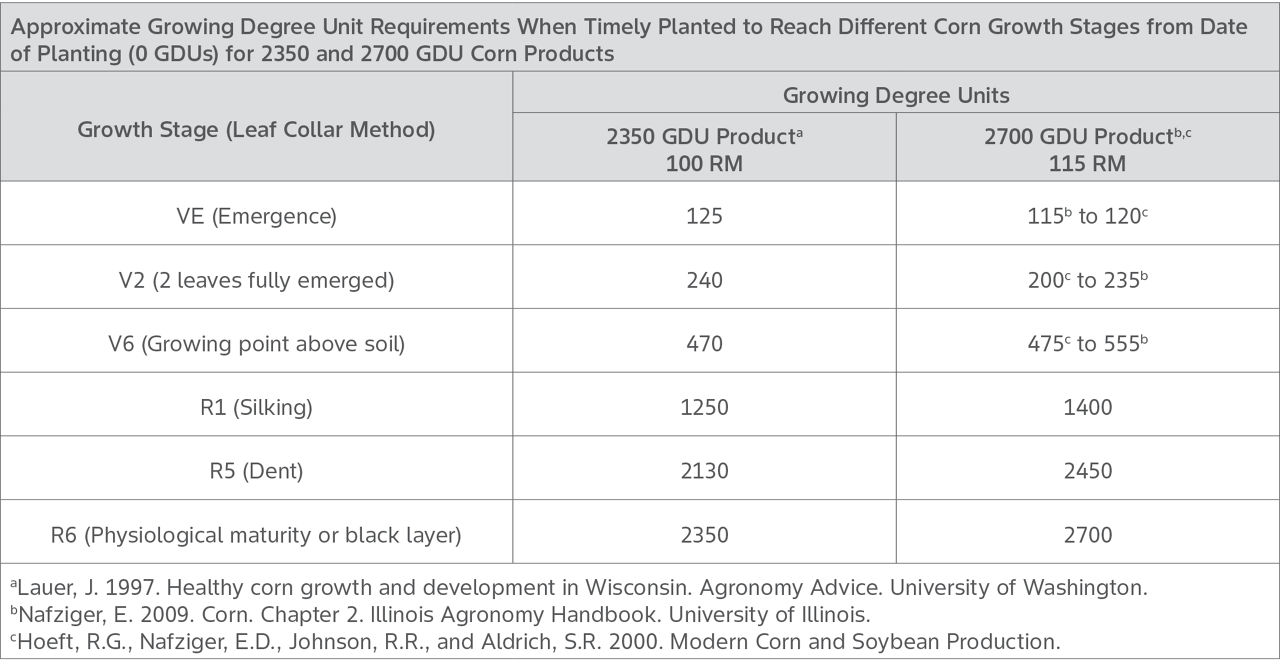
General relationships for black layer attainment and kernel moisture content can be determined based on GDU accumulation. This calculation can then help provide guidelines for harvest timing and fall grain marketing. As an example, Table 1 provides GDU information for corn products with approximate relative maturities of 100 and 115 days. The kernel milk line can be used as a measure of kernel moisture content as the kernel advances toward black layer (Figure 2). Fully dented kernels require about 13 to 20 calendar days or 200 to 375 GDU (depending on product RM) to achieve black layer.
Table 1. Approximate Growing Degree Unit Requirements.
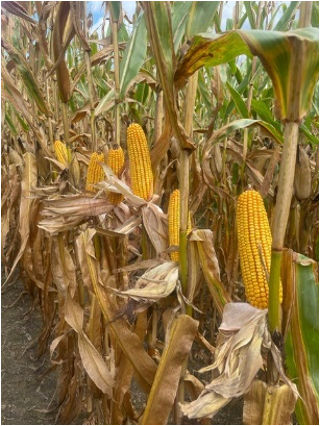
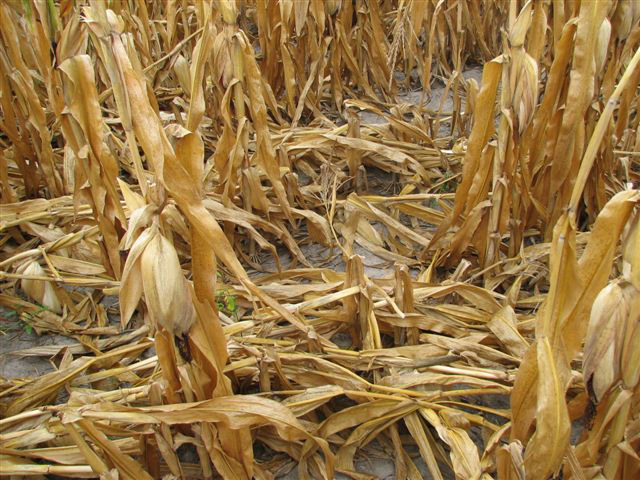
For harvest scheduling, grain moisture content should be monitored soon after black layer occurrence (Figures 1 and 3). A harvest moisture content level that balances harvest losses and grain drying costs helps maximize economic return potential. Consider starting harvest when corn grain moisture content is a little above 25% to help maximize yield potential, as field drying to 15% moisture content or less increases the risk of mechanical ear droppage and kernel shattering during harvest.1 If the crop has been stressed or impacted by stalk borers or disease, stalk integrity may be compromised, increasing the potential for lodging and for the combine header to be unable to gather ears effectively (Figure 4). Lodged corn plants can increase stress and fatigue for the combine operator, increase overall harvest time, and increase the potential for mechanical damage to the combine.
With high temperatures, it is extremely easy to underestimate the rate at which grain dries. Grain that matures in late July can have an average daily dry down rate of around 0.8 percentage points per day compared to 0.4 percentage points per day for grain nearing maturity later in the season.1 Purdue University studies showed that moisture content losses increased from about 0.5% per day to about 0.75% per day as the mean GDU accumulation per day increased.7 Regardless of the environment, it is normal to see later RM corn products reach harvestable moisture content levels (around 25%) later than earlier RM products.3 Other corn product characteristics also influence drydown rate, such as the tightness of husk leaves and the thickness of the seed’s pericarp.3,7
Characteristics That Help Promote Loss of Corn Kernel Moisture Content
- Thinner, fewer, and loose husk leaves.
- Rapidly drying husk leaves.
- Exposed ear tips.
- Ears that droop sooner after black layer.
- Thinner kernel pericarps.7
Corn Maturity Calculators
Corn maturity calculators are available online from universities and other sources to help estimate a maturity date for a corn crop. The estimation is determined by entering the location, planting date, and the GDU to silk or black layer for the corn product planted. It is important to note that the calculators may not account for GDU compression, which occurs after a delayed planting season. In these situations, black layer may develop with fewer accumulated GDUs than the corn products’ designated genetic maturity.8
Iowa State University: The Corn DryDown Calculator: A Tool to Guide Harvest Timing9
Kansas State University (for state of Kansas only): Degree Days10
Purdue University: U2U Decision Support Tools – Corn GDD11
Cornell University: CSF Growing Degree Day Calculator12
In addition to harvesting at an optimum grain moisture content, proper combine settings can also help increase efficiency, maximize grain quality potential, and minimize field losses. Always follow the manufacturer’s equipment setting recommendations.
For additional information on topics mentioned above, please read the following articles:
Maturities and Response to Delayed Planting
Corn Grain Fill During Drought Stress
Combine Calibration for Accurate Yield Data
Combine Adjustments and Maintenance for Harvest
Freeze Injury to Corn and Silage
Sources
1Nielsen, R.L. 2021. Grain fill stages in corn. Purdue University, Corny News Network. https://www.agry.purdue.edu/ext/corn/news/timeless/GrainFill.html.
2Frost. 2014. (original 2006). Corn Agronomy. University of Wisconsin-Madison. https://corn.agronomy.wisc.edu/Management/L041.aspx
3Nielsen, R.L. 2018. Field drydown of mature corn grain. Purdue University, Corny News Network. https://www.agry.purdue.edu/ext/corn/news/timeless/GrainDrying.html
42016. Corn development. University of Wisconsin, Corn Agronomy. https://corn.agronomy.wisc.edu/Management/L011.aspx
5Hall, R.G. 2014. Corn growth stages with estimated calendar days and growing-degree units. South Dakota State University. https://mygeohub.org/resources/878
6Nleya, T., Chungu, C., and Kleinjan, J. Chapter 5: Corn growth and development. In Clay, D.E., Carlson, C.G., Clay, S.A., and Byamukama, E. (Eds.) iGrow corn: Best management practices. South Dakota State University, SDSU Extension. https://extension.sdstate.edu/sites/default/files/2019-09/S-0003-05-Corn.pdf
7Nielsen, B. 2001. Post-maturity grain drydown in the field. Purdue Cooperative Extension Service, Pest & Crop. 24. https://extension.entm.purdue.edu/pestcrop/2001/issue24/
8Agyei, B.K., Andresen, J., and Singh, M. 2023. Estimating corn maturity vs. frost dates: Online tool ‘useful to usable’. Michigan Farm Bureau, Michigan Farm News. https://www.michiganfarmnews.com/estimating-corn-maturity-vs-frost-dates-online-tool-useful-to-usable-
9Archontoulis, S. and Saenz, E. 2025. The corn drydown calculator: A tool to guide harvest timing. Iowa State University Extension and Outreach, Integrated Crop Management. https://crops.extension.iastate.edu/post/corn-drydown-calculator-tool-guide-harvest-timing
10Weather data library. Kansas Mesonet. Kansas State University. https://mesonet.k-state.edu/agriculture/degreedays/
11Anderson, J., Angel, J., Biehl, L., et al. U2U decision support tools – corn GDD. Midwestern Regional Climate Center. https://mrcc.purdue.edu/tools/corngdd
12DeGaetano, A., Moore, R., Belcher, B. and Eck, B. 2016. CSF Growing Degree Day Calculator. CSF Climate Smart Farming, A program of Cornell University. https://climatesmartfarming.org/tools/csf-growing-degree-day-calculator/
Additional Resources
Lauer, J. 1997. Healthy corn growth and development in Wisconsin. University of Wisconsin, Agronomy Advice. https://corn.agronomy.wisc.edu/AA/A016.aspx
Nafziger, E. 2009. Chapter 2: Corn. In Illinois agronomy handbook. University of Illinois.
Hoeft, R.G., Nafziger, E.D., Johnson, R.R., and Aldrich, S.R. 2000. Modern corn and soybean production. MCSP Publications.
Web sites verified 7/23/26. 1214_152486
Disclaimer
ALWAYS READ AND FOLLOW GRAIN MARKETING AND ALL OTHER STEWARDSHIP PRACTICES AND PESTICIDE LABEL DIRECTIONS.